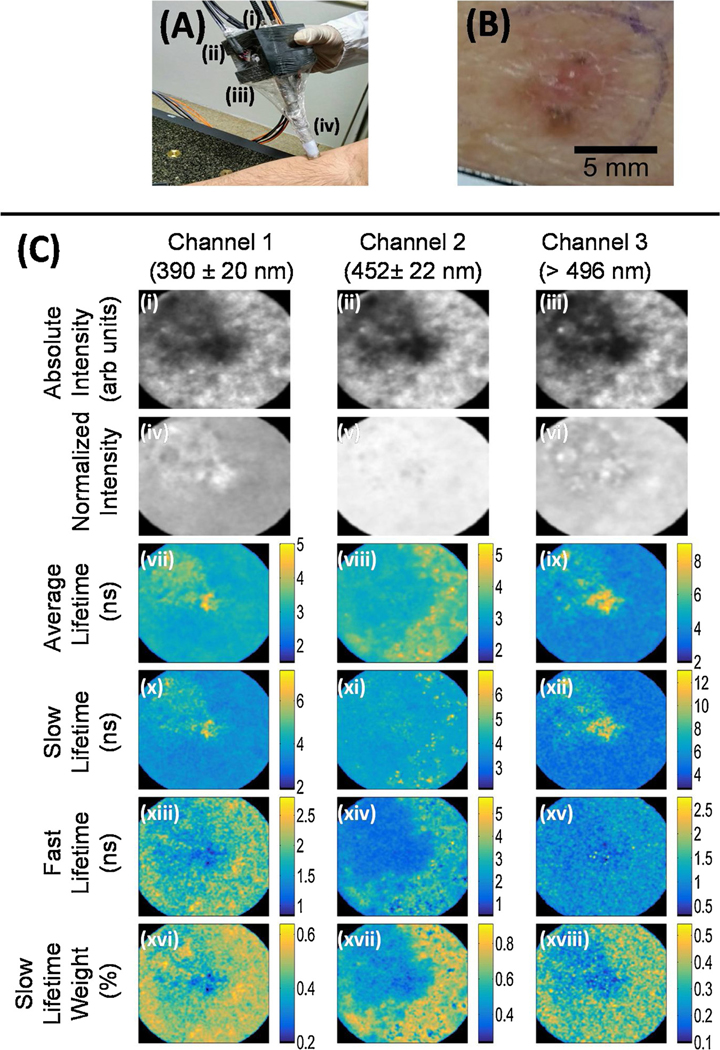
Fig. 2.
(A) Handheld FLIm dermoscope placed on the forearm region of a human subject. Excitation and acquisition fibers are attached at the back of the probe (i), while the galvo mirror controls are held laterally (ii) at the probe printed case (iii), above the rigid lens tube (iv). (B) Clinical photograph of the imaged nBCC lesion. (C) Multispectral FLIm parameter maps of the nBCC lesion. The columns show fluorescence parameters related to the three detection channels. Integrated intensity images are shown in the first row; the second row shows normalized intensity images; the third row shows the average lifetime image; further rows show bi-exponential fitting parameters for the decay: slow and fast decays 𝜏𝑠𝑙𝑜𝑤 and 𝜏𝑓𝑎𝑠t in ns, and weight 𝑎𝑓𝑎𝑠t. The color maps indicate the values of the weights and decay times. The dimensions of the FLIm images are 8.65 × 8.65 𝑚𝑚2.

