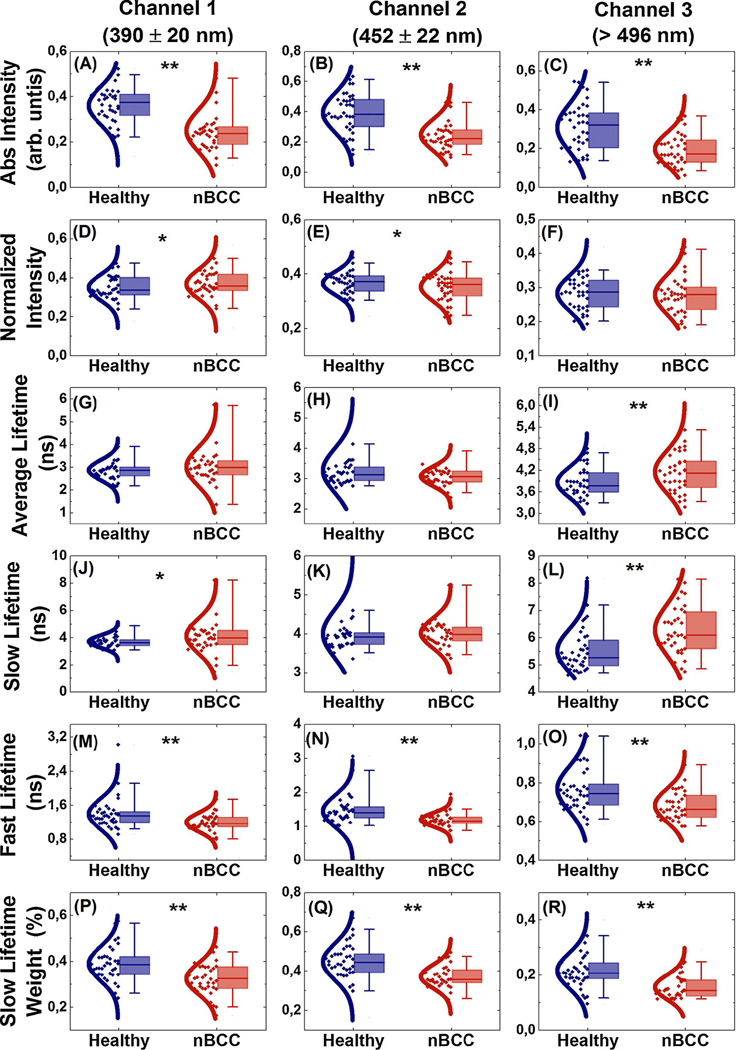
Fig. 3.
Boxplots of FLIm median values for healthy (blue) and nBCC (red) regions. From top to bottom, the rows show the integrated intensity (arb. units), normalized intensity, average, slow, and fast lifetime values (ns), and slow lifetime weight (%). The columns correspond to the three detection channels. Significant differences are indicated by * (p < 0.05) and ** (p < 0.001).

