. 2021 May 6;143(9):091004. doi: 10.1115/1.4050647

Fig. 5.

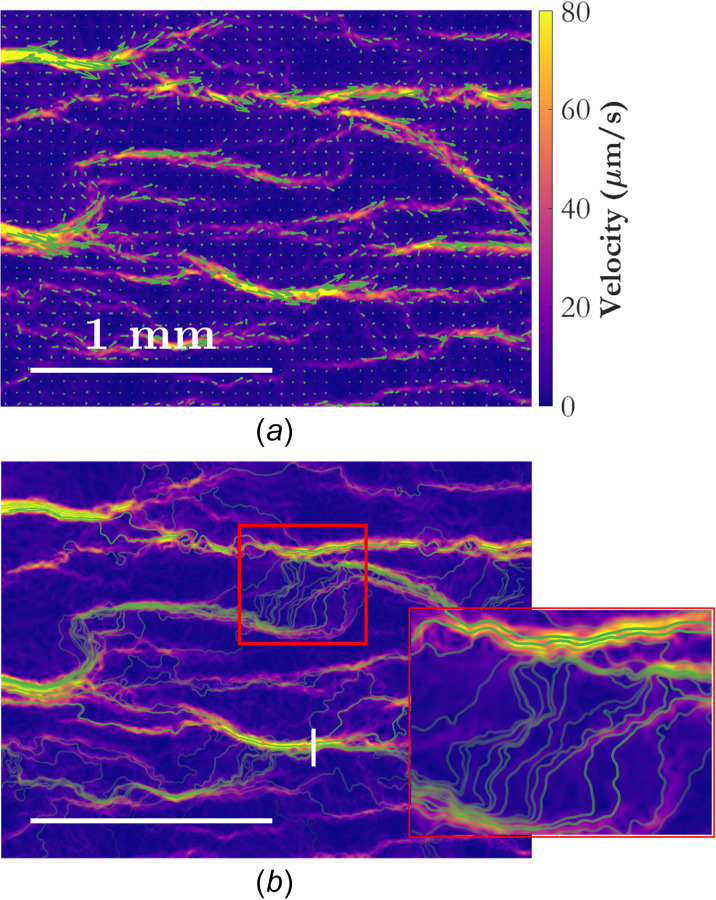
Instantaneous snapshots of the velocity field at t = 330 s for wOFV showing (a) velocity vectors and (b) streamlines, each shown in green. The velocity field is colored according to velocity magnitude. Velocity vectors are subsampled by a factor of 30 in both dimensions and scaled by a factor of 20 to aid in visualization. The transparency for each streamline is set according to the mean residence time along that streamline, with more transparency indicating a longer residence time (lower average velocity). The vertical white line in (b) is referenced in Fig. 7. The horizontal white lines indicate the spatial scale. A zoomed-in image of the region marked by a red rectangle in (b) shows the streamlines in finer detail.

Instantaneous snapshots of the velocity field at t =330 s for wOFV showing (a) velocity vectors and (b) streamlines, each shown in green. The velocity field is colored according to velocity magnitude. Velocity vectors are subsampled by a factor of 30 in both dimensions and scaled by a factor of 20 to aid in visualization. The transparency for each streamline is set according to the mean residence time along that streamline, with more transparency indicating a longer residence time (lower average velocity). The vertical white line in (b) is referenced in Fig. 7. The horizontal white lines indicate the spatial scale. A zoomed-in image of the region marked by a red rectangle in (b) shows the streamlines in finer detail.