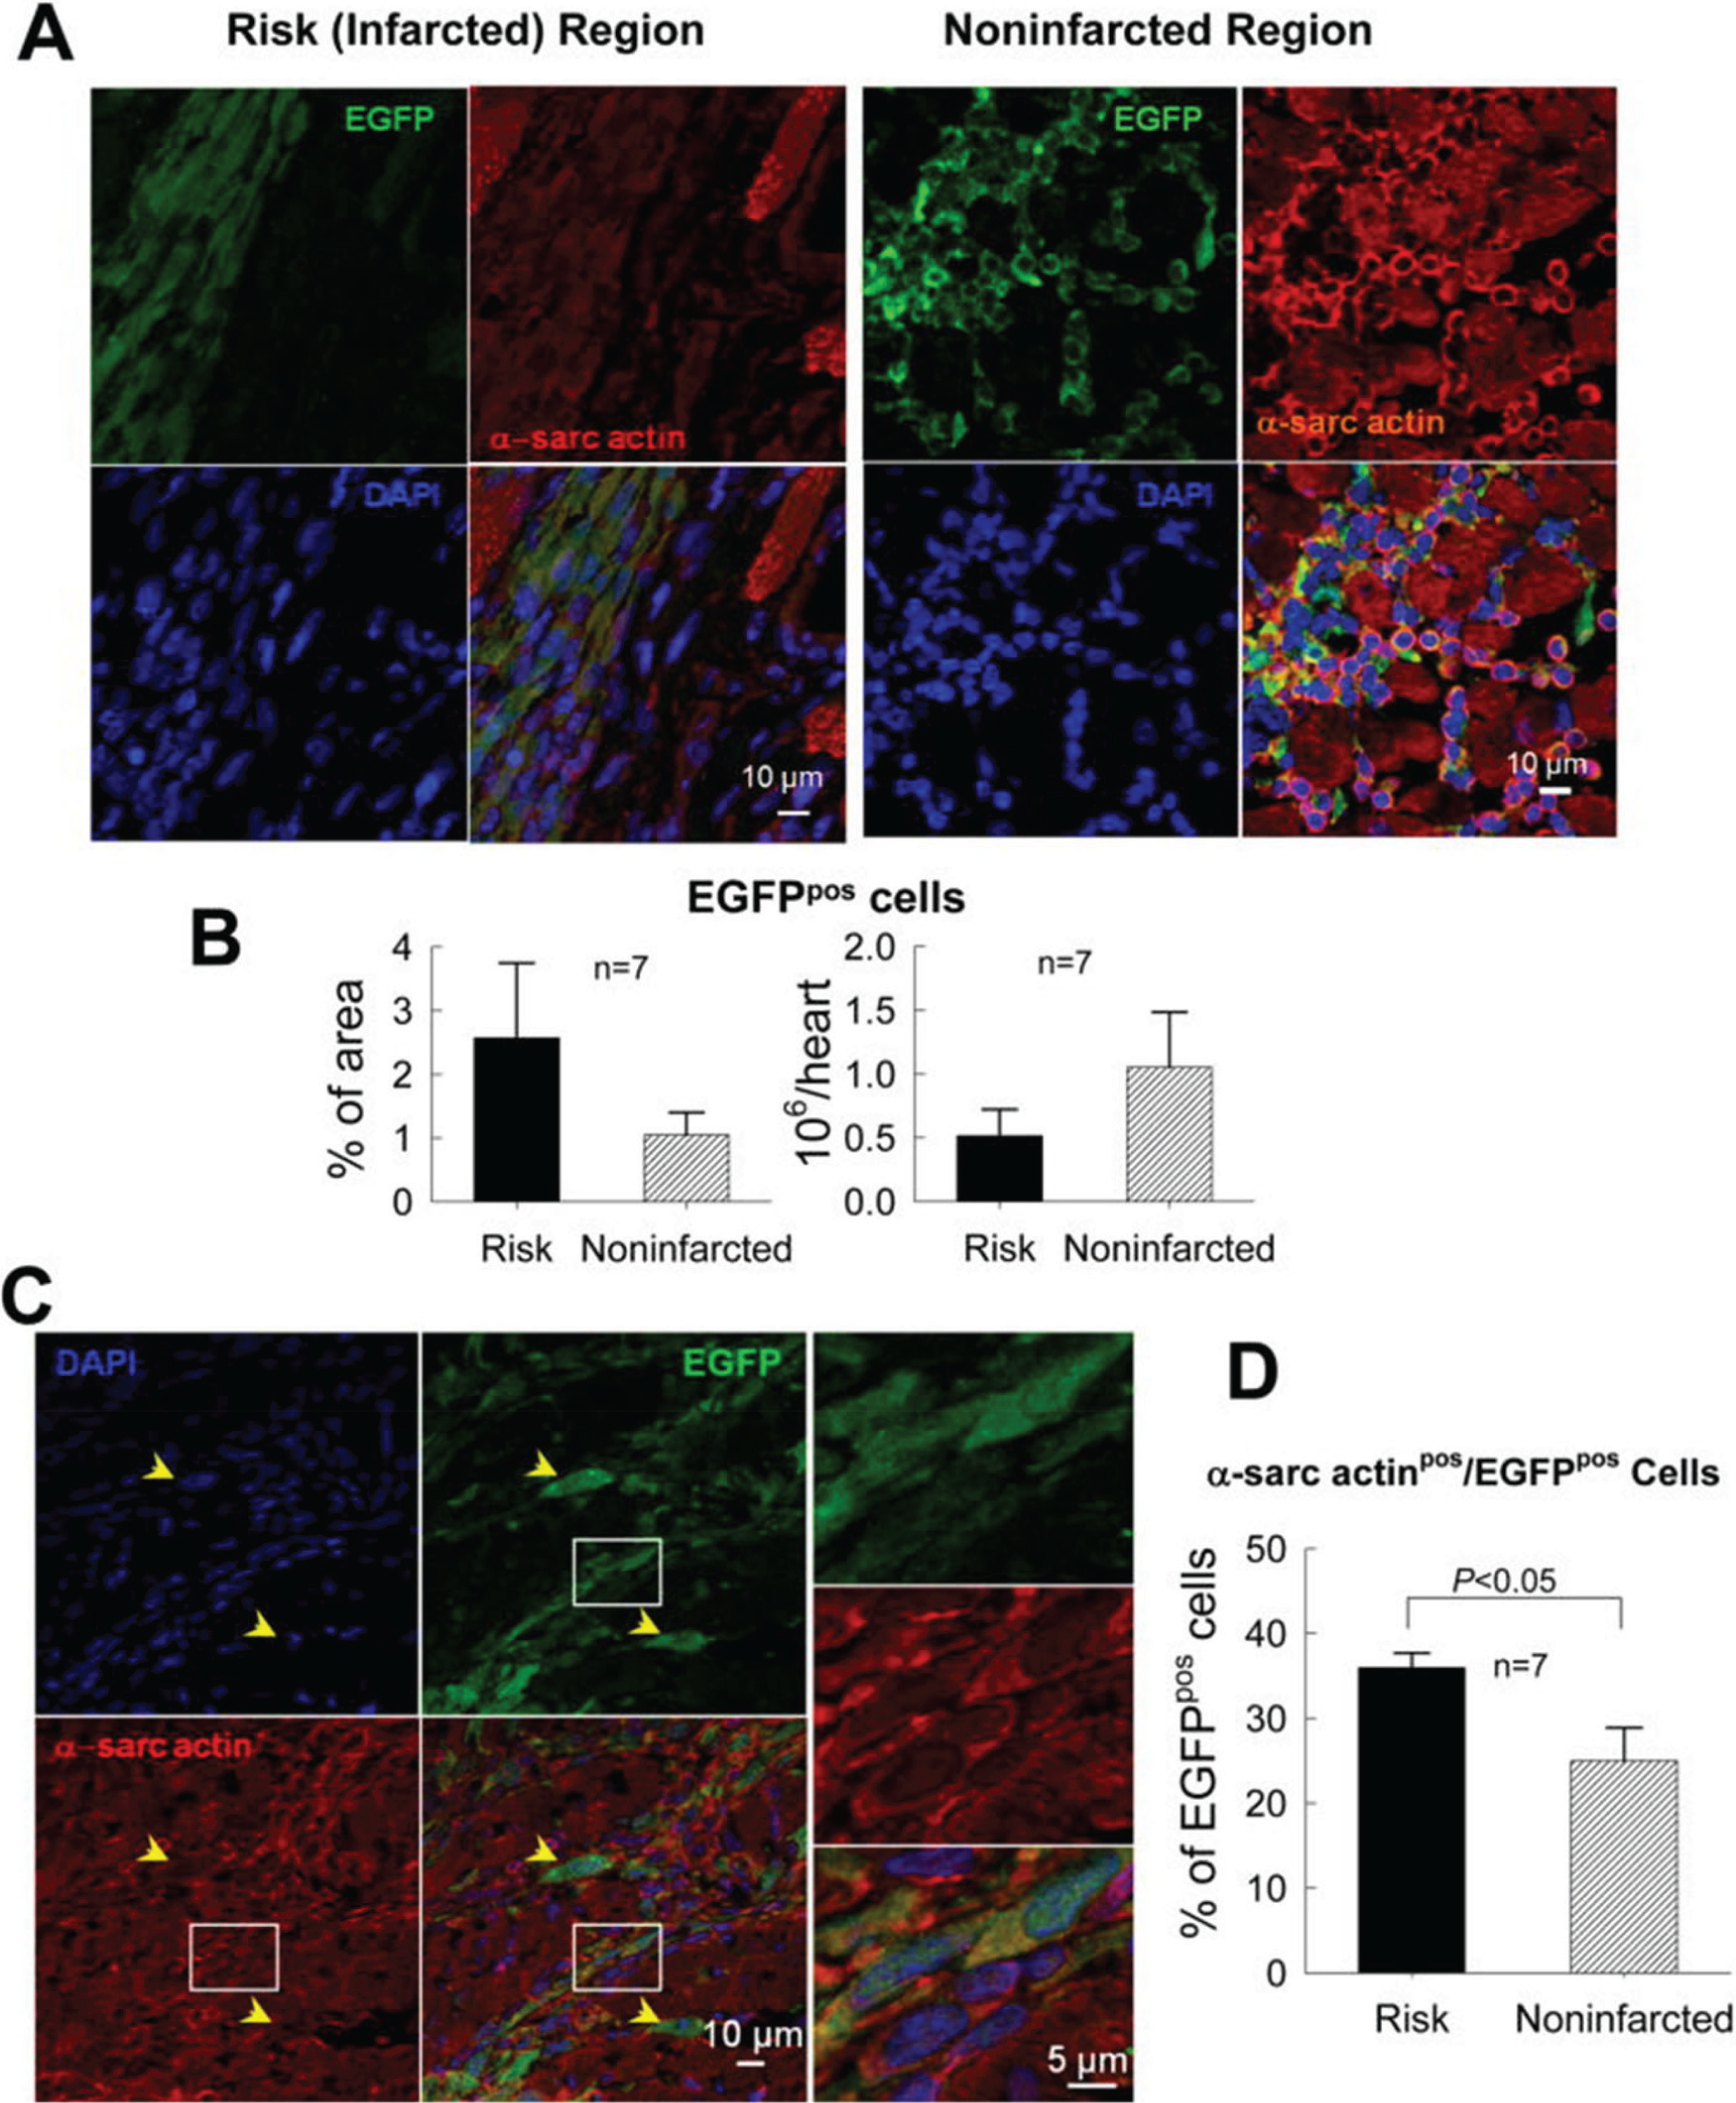
Fig. 1.

Myocardial content and differentiation of transplanted CPCs in a rat model of chronic ischemic cardiomyopathy (old MI). C-kit+ CPCs were labeled with EGFP and injected 30 days after MI. (A) Representative confocal microscopic images from a CPC-treated rat showing presence of transplanted CPCs in the risk (infarcted) and noninfarcted regions, as evinced from immunoreactivity for EGFP (green). Some EGFPpos cells also express α-sarcomeric actin (α-sarc actin; red). (B) Quantitation of EGFPpos cells in the risk and noninfarcted region, expressed as percent EGFPpos myocardial area and as total calculated number of EGFPpos cells per heart. The number of EGFPpos cells per heart was estimated by multiplying the number of EGFPpos cells per unit area by the estimated number of EGFPpos cells present through the thickness of each slice in which EGFPpos cells were found (estimated 100 cells per 2 mm thickness of slice). (C) Representative confocal microscopic images showing colocalization of EGFP and α-sarcomeric actin in several cells in the border zone (the area in the white box is magnified in the three panels on the right). Yellow arrowheads indicate EGFPpos cells that do not express α-sarcomeric actin. (D) Quantitative analysis of α-sarcomeric actinpos/EGFPpos cells. The figure illustrates the fact that very few CPCs (or CPC-derived cells) remained in the heart that expressed markers of cardiogenic commitment such as sarcomeric proteins; furthermore, these cells were small and did not exhibit the typical morphology and sarcomeric structure of mature cardiac myocytes. Data are means ± SEM. Reproduced with permission from Tang et al. (2010).
