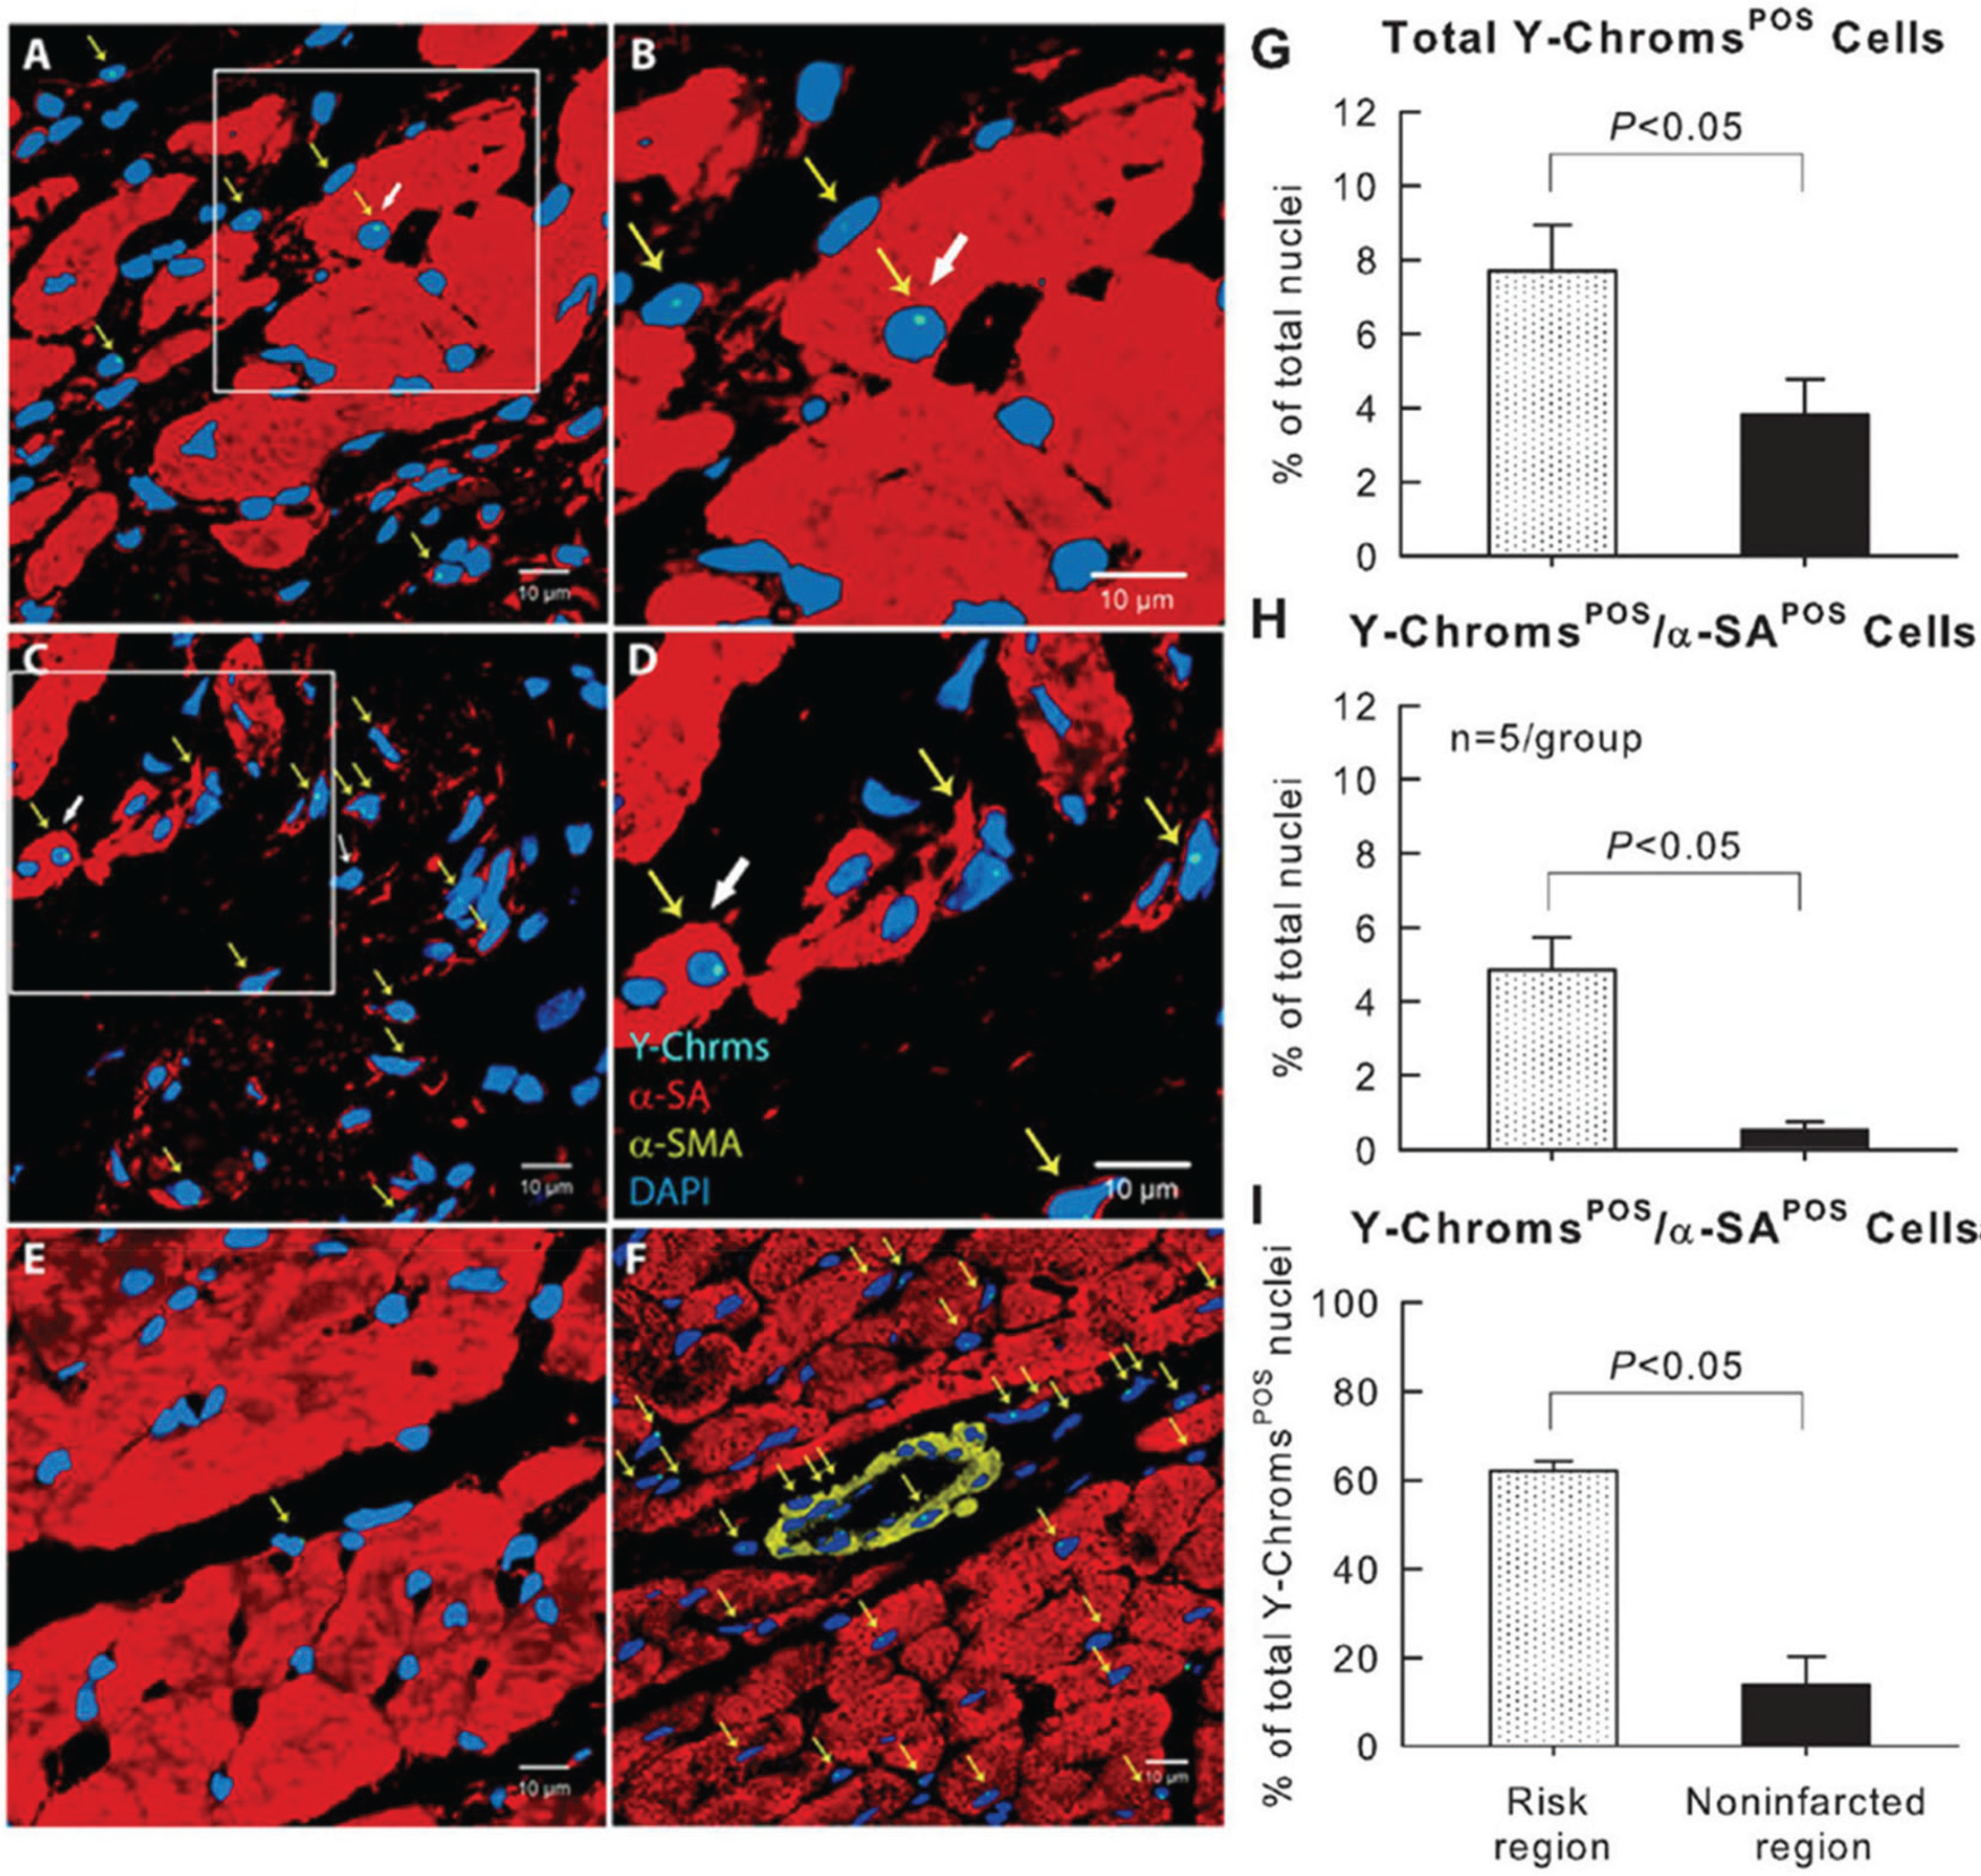
Fig. 3.

Detection of CPC retention and engraftment with fluorescence in situ hybridization (FISH) for detection of Y-chromosomes 1 year after CPC transplantation in rats. (A–E) Male c-kit+ CPCs were injected into female rats after acute MI and the hearts were harvested 1 year later. Positivity for Y-chromosomes in representative confocal microscopic images obtained from the border zone (A, B), scarred region (C, D), and noninfarcted region (E) identifies exogenous CPCs. Yellow arrows indicate all Y-chromosome positive cells, whereas white arrows indicate Y-chromosome cells with a myocyte-like appearance. (B) and (D) are higher magnification images of the boxes in (A) and (C), respectively. (F). Male heart tissue (positive control); Y-chromosome fluorescent signals are not present in all nuclei because some signals are out of the plane of focus used for the image. Y-chromosomes (Y-Chroms) are shown in cyanine blue, α-sarcomeric actin (α-SA) is shown in red, α-smooth muscle actin (α-SMC) is shown in yellow, and nuclei are stained with DAPI (blue). (G–I) Quantitative analysis of the number of Y-chromosome/α-SA double positive cells at 1 year after CPC transplantation. Note that very few CPCs (or their progeny) remained in the heart at 1 year after transplantation; as was the case at 35 days after transplantation (Hong et al. 2014; X.L. Tang et al. 2010, 2015, 2018; Tokita et al. 2016), these cells did not exhibit the morphology and structure of mature cardiomyocytes. Data are means ± SEM. The region at risk comprises both the border zones and the scarred region. Bars are 10 μm. Reproduced with permission from Tang et al. (2016).
