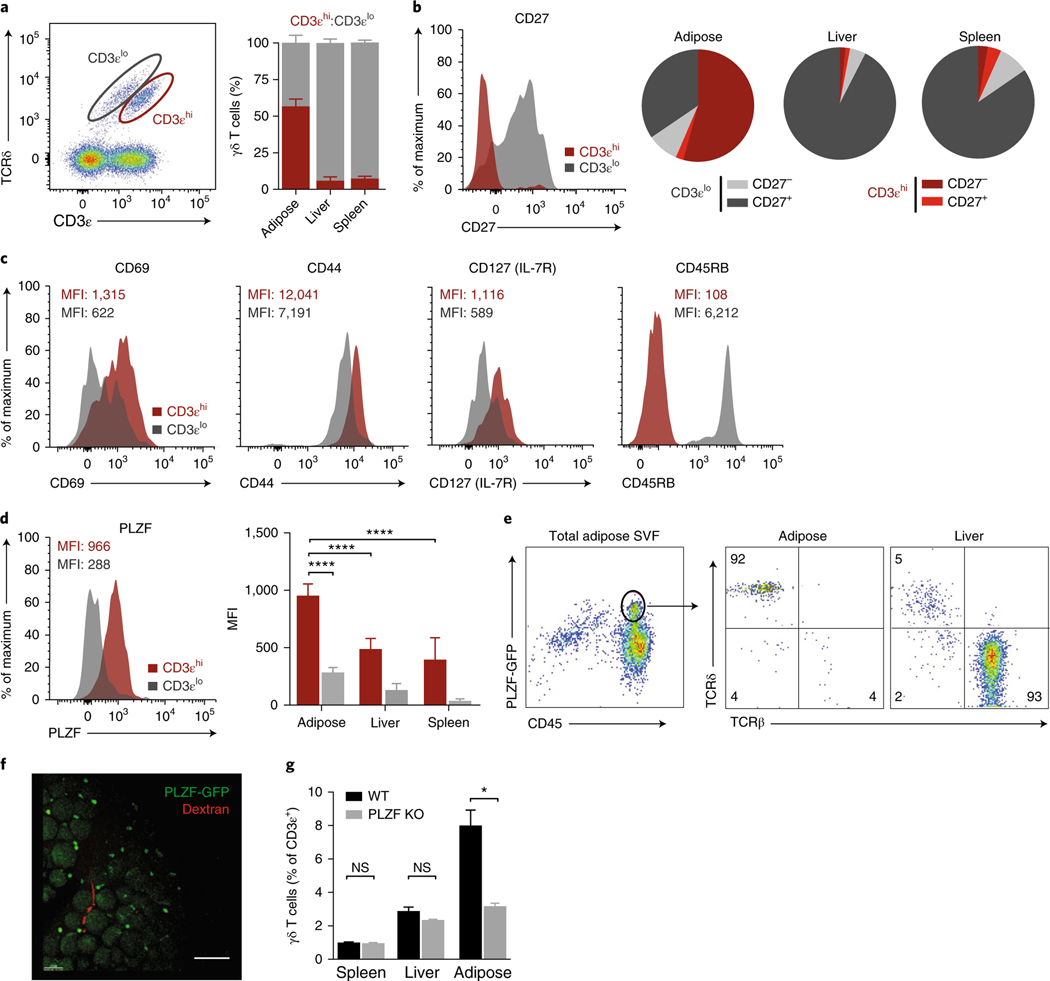
Fig. 2 |. PLZF discriminates two γδ T cell populations.
a, Representative flow cytometry and frequency quantification of CD3εhi and CD3εlo γδ T cells from eWAT SVF across adipose, liver, and spleen (n = 5 mice). b, CD27 expression by CD3εhi and CD3εlo γδ T cells (left) and subset quantification from adipose, liver, and spleen (right) (n = 5 mice). c, Representative histograms of mean fluorescence intensity (MFI) of CD69, CD44, CD127, and CD45RB expression by CD3εhi and CD3εlo γδ T cells. d, Representative histogram of PLZF expression by CD3εhi and CD3εlo γδ T cells (left) and MFI quantification across adipose, liver, and spleen (right) (n = 5 mice). e, Representative flow cytometry and quantification of TCRβ+ versus TCRδ+ cells of PLZF+CD45+ cells from eWAT SVF. f, Immunofluorescence microscopy of whole-mount adipose tissue from Zbtb16GFP mice (green) injected with dextran (red). Scale bar, 100 μm. g, Frequency of γδ T cells from wild-type (WT) and Zbtb16−/− mice (n = 5). KO, knockout. NS, not significant (P > 0.05); *P < 0.05; ****P < 0.0001 (one-way ANOVA). Data are representative of three experiments (a–e; mean ± s.e.m. in a,d) or two experiments (f,g; mean ± s.e.m. in g).

