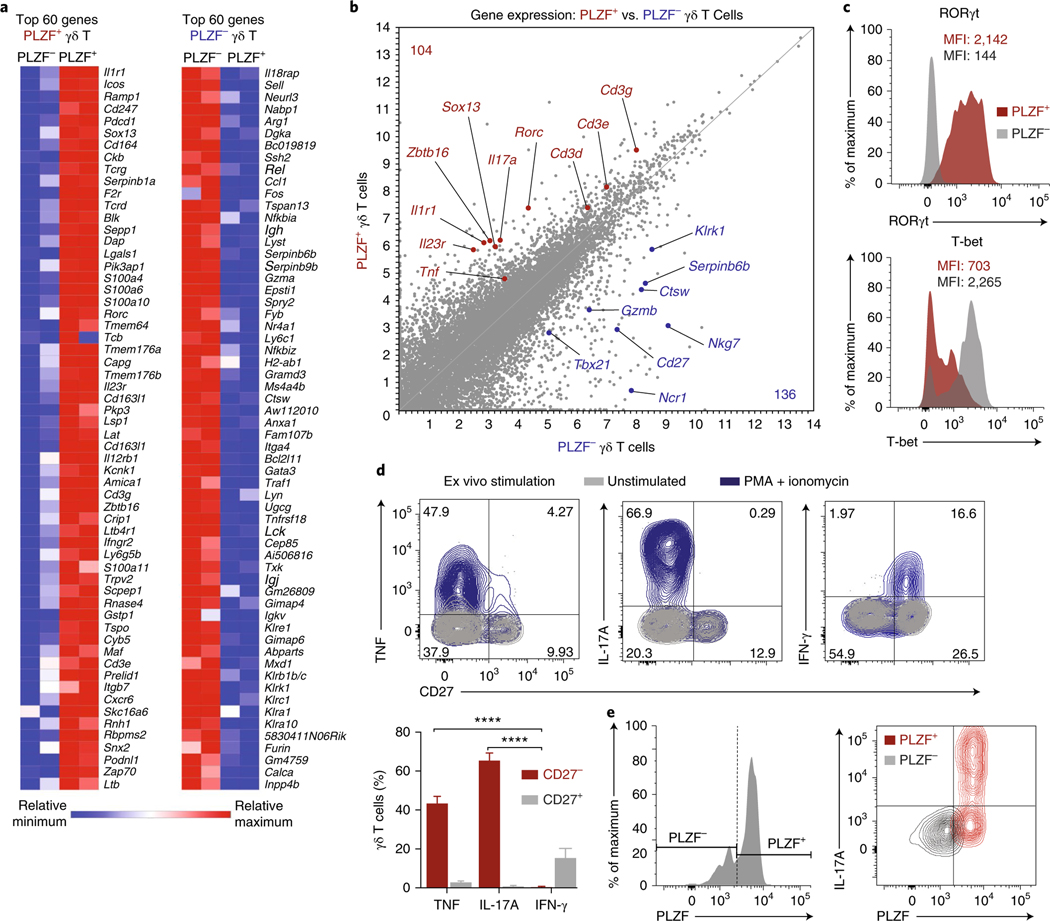
Fig. 4 |. PLZF+ γδ T cells are innate-IL17A− producing cells.
a, Heat map of the top 60 genes differentially expressed (false-discovery-rate-adjusted P value < 0.01) between PLZF+ (left) and PLZF− (right) γδ T cells. b, Scatter plot of gene transcripts differentially expressed by PLZF+ and PLZF− γδ T cells from 14-week-old male mice. c, Flow cytometry of RORγt (top) and T-bet (bottom) expression in PLZF+ and PLZF− γδ T cells from eWAT SVF. d, Representative intracellular cytokine staining (top) and quantification (bottom) on gated γδ T cells from eWAT SVF for TNF, IL-17A, and IFN-γ after 4-h stimulation with PMA and ionomycin (n = 4 mice). e, Representative intracellular IL-17A staining of gated PLZF+ and PLZF− γδ T cells from eWAT SVF after 4-h treatment with PMA and ionomycin (n = 5 mice). Small horizontal lines indicate the mean. NS, not significant (P > 0.05); *P < 0.05; **P < 0.01; ****P < 0.0001 (one-way ANOVA in d). Data are representative of two experiments (c–e; mean ± s.e.m. in d).

