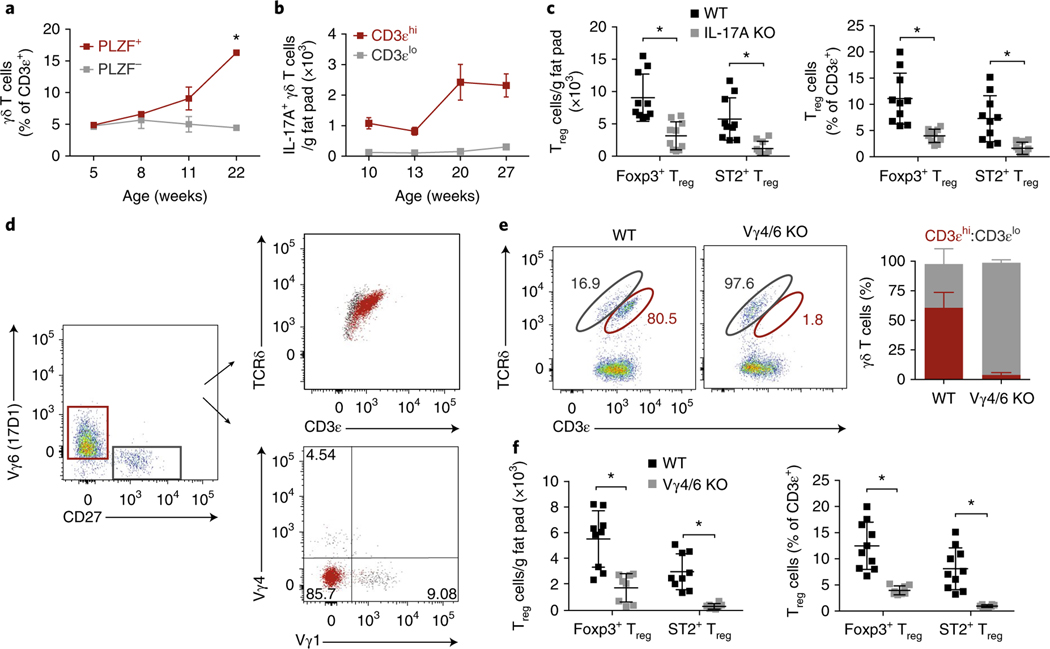
Fig. 5 |. ST2+ Treg numbers depend on PLZF+ γδ T cells and IL-17A.
a, Frequency of PLZF+ and PLZF− γδ T cells from eWAT at 5, 8, 11, and 22 weeks of age (n = 5 mice per time point). b, Numbers of GFP+ CD3εhi and CD3εlo γδ T cells from eWAT of Il17aGFP male mice at 10, 13, 20, and 27 weeks of age (n = 5 mice per time point). c, Numbers and frequency of ST2+ and total Treg cells from eWAT of 16-week-old males from WT and Il17a−/− mice (n = 5 mice, pooled). d, Representative flow cytometry of γδ T cells stained with anti-CD27, 17D1, anti-Vγ1, and anti-Vγ4 to characterize TCR usage. e, Representative flow cytometry plots of γδ T cells from WT and Vg4/6−/− eWAT (left) and quantification of CD3εhi and CD3εlo γδ frequencies (right) (n = 5 mice). f, Numbers and frequency of ST2+ and total Treg cells from eWAT of 16-week-old WT and Vg4/6−/− male mice (n ≥ 4). Each symbol represents an individual mouse; small horizontal lines indicate the mean. NS, not significant (P > 0.05); *P < 0.05 (one-way ANOVA in a,c,f). Data are pooled across two experiments (mean ± s.e.m. in a–c,f) or representative of two experiments (d,e; mean ± s.e.m. in e).

