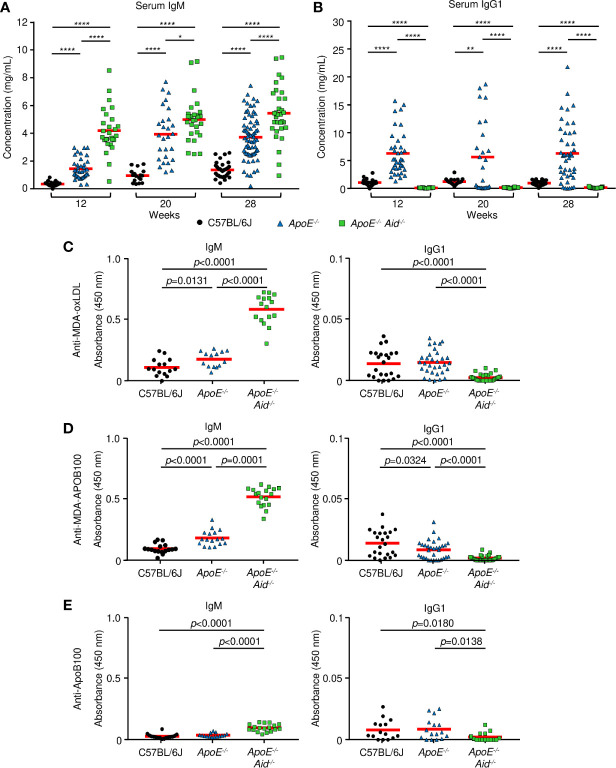
Figure 3.
Serum antibody concentrations from mice. (A, B) total immunoglobulin measured by ELISA at 12, 20 and 28 weeks on a high fat diet. (A) IgM and (B) IgG1 from C57BL/6J (black circle), ApoE-/- (blue triangle) or ApoE-/- Aid-/- (green square) mice. Red line represents the mean from 17 or more independent mice. *0.05 > p > 0.01, **0.01 > p > 0.001, ***0.001 > p > 0.0001, ****p < 0.0001. (C–E), IgM and IgG1 antibody titers measured by ELISA at 28 weeks on the diet. (C) MDA-oxLDL, (D) MDA-ApoB100, and (E) ApoB100. IgM sera was diluted 1:1000, and IgG1 sera was diluted 1:200 for analysis. Symbols represent percentages in individual mice with red line displaying the mean from 14-16 mice per genotype. Significance was determined by two-tailed T-test.

