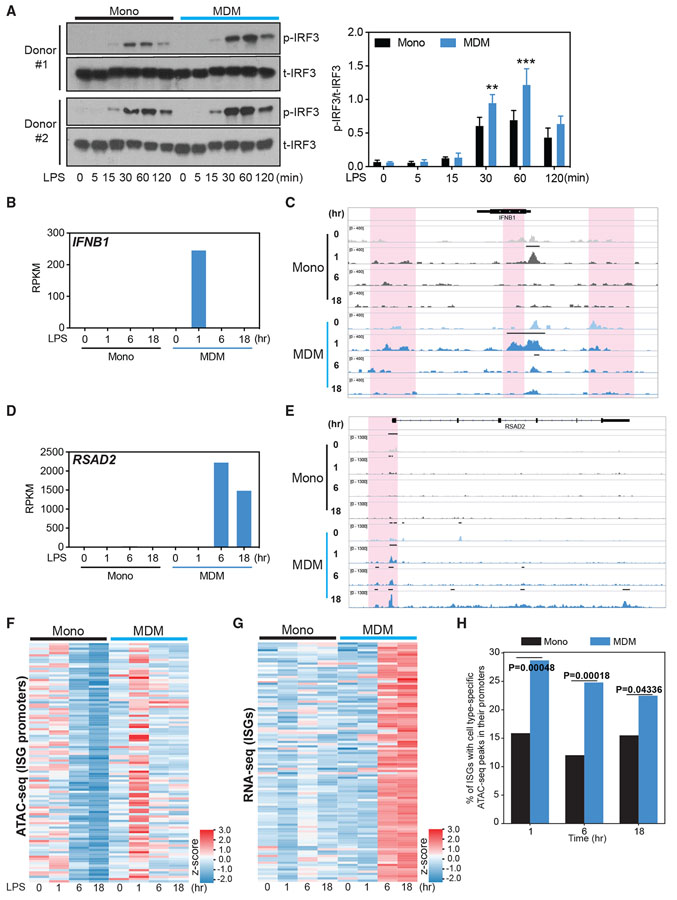
Figure 4. Chromatin accessibility precedes the induction of ISGs by LPS in MDMs.
(A) Total IRF3 (t-IRF3) and phosphorylated IRF3 (p-IRF3) measured by western blot in monocytes and MDMs stimulated with LPS (10 ng/mL) for 0, 5, 15, 30, 60, and 120 min. Data are representative of 2 independent donors. Normalized band intensity from 3 independent donors is shown at right. Error bars indicate SEMs. Statistics were determined by 2-way ANOVA with Sidak’s correction. **p < 0.01; ***p < 0.001.
(B–E) Normalized gene expression value (RPKM), as determined by RNA-seq, of IFNB1 (B) and RSAD2 (D), with corresponding IGV browser tracks showing chromatin accessibility (C and E) at the 2 gene loci in monocytes and MDMs stimulated with LPS (10 ng/mL) for 0, 1, 6, or 18 h, respectively. The red shading area in (C) and (E) indicates changes in ATAC-seq peaks.
(F and G) Heatmaps showing chromatin accessibility at the ISG promoter region (F), determined by ATAC-seq read abundance on all datasets around the peak center (±2.5 kb/2.0 kb) of promoters for ISG genes, and the expression of these ISGs (G), measured by RNA-seq, in monocytes and MDMs stimulated with LPS (10 ng/mL) for 0, 1, 6, or 18 h.
(H) ATAC-seq peak enrichment within promoters of ISGs in MDMs and monocytes. The genomic coordinates of promoter regions of expressed ISGs (±1 kb to the transcription start site [TSS]) were intersected with various categories of ATAC-seq peaks (e.g., the set of peaks that are stronger in MDMs compared to monocytes 1 h post-stimulation). The y axis indicates the proportion of expressed ISG promoters that contain a monocyte- or MDM-specific ATAC-seq peak at the given time point. p values were calculated using an “N-1” chi-square proportions test comparing the 2 values at each time point.

