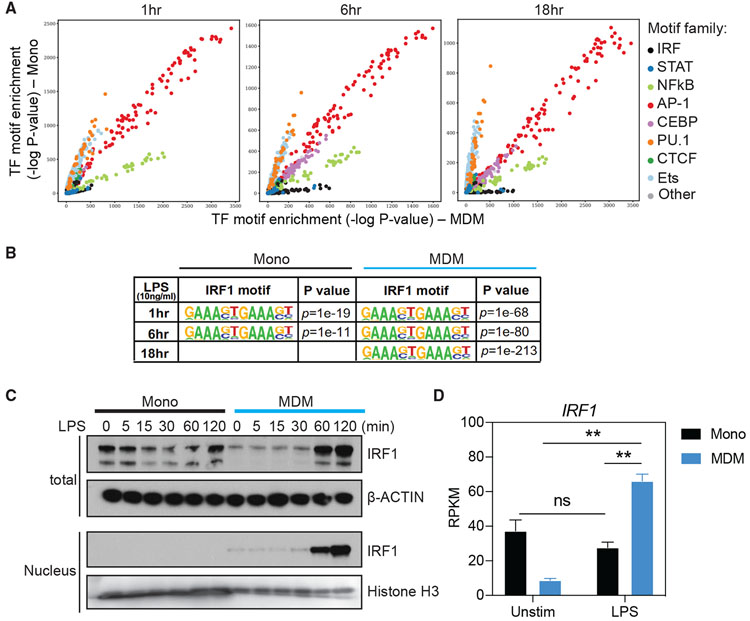
Figure 5. Enrichment of IRF binding motifs and increase of IRF1 translocation to the nucleus in MDMs upon TLR4 stimulation.
(A) Comparison of genome-wide TF motif enrichment in ATAC-seq peaks specific to monocytes or MDMs. Cells were stimulated for indicated time points with 10 ng/mL LPS. Chromatin accessibility was assessed using ATAC-seq. For each time point, the DNA sequences within peaks unique to monocytes or MDMs were assessed for the enrichment of TF binding site motifs using HOMER and motifs contained in the Cis-BP database (see Method details). The significance (−log10 p value) of the motif enrichment in monocytes (y axis) and MDMs (x axis) is shown as a dot. The dots are colored based on the family of TFs. See Figure S5A for the same analysis performed separately in promoter and enhancer regions.
(B) IRF1 binding motifs in genome-wide open chromatin regions and the enrichment p values in monocytes and MDMs stimulated with LPS (10 ng/mL) for 1, 6, and 18 h.
(C) Western blot analysis of IRF1 abundance in total cell lysate and nuclear extracts from monocytes and MDMs stimulated with LPS (10 ng/mL) for 0, 5, 15, 30, 60, and 120 min. β-Actin and histone H3 were used for the loading control of total cell lysate and nuclear fraction, respectively.
(D) Normalized gene expression value (RPKM), as determined by RNA-seq, of IRF1 in unstimulated and LPS-stimulated (18 h) monocytes and MDMs. Error bars indicate SEMs. Statistics were determined by 2-way ANOVA with Tukey’s correction. ns, not significant; **p < 0.01.

