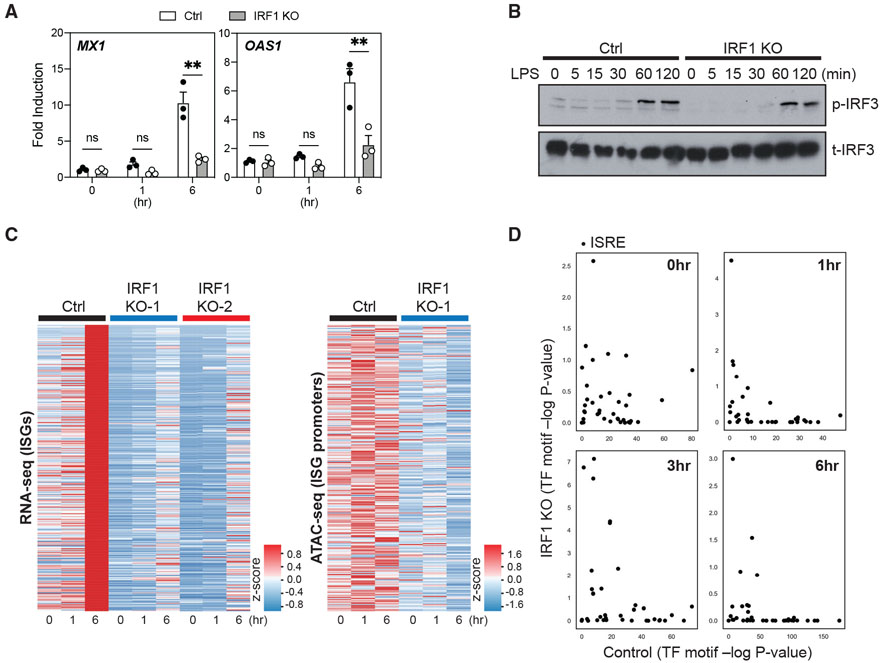
Figure 6. IRF1 deficiency impairs expression and chromatin accessibility of ISGs in LPS-stimulated, macrophage-like THP-1 cells.
(A) The expression of MX1 and OAS1 measured by quantitative RT-PCR in PMA-differentiated control (Ctrl) or IRF1 KO THP-1 clones, following stimulation with LPS (10 ng/mL) for 0, 1, or 6 h. The expression of these genes is shown as fold induction compared to the respective unstimulated (0 h) control. Data represent 3 distinct Ctrl and IRF1 KO clones. Error bars represent SEMs. Statistics were determined by repeated-measure 2-way ANOVA with Sidak correction. **p < 0.01.
(B) Total IRF3 (t-IRF3) and p-IRF3 were detected by western blot in PMA-differentiated control (Ctrl) or IRF1 KO THP-1 clones following stimulation with LPS (10 ng/mL) for 0, 5, 15, 30, 60, and 120 min. Data are representative of 2 independent experiments.
(C) Heatmaps showing the expression (left, determined by RNA-seq) of ISGs and chromatin accessibility (right, determined by ATAC-seq) at ISG promoter loci (±2.5 kb/2.0 kb around the peak center) in PMA-differentiated control (Ctrl) or IRF1 KO THP-1 clones. Cells were stimulated with LPS (10 ng/mL) for 0, 1, or 6 h. Data depict experiments with 1 Ctrl or 2 different IRF1 KO THP-1 clones (RNA-seq) or with 1 Ctrl or 2 IRF1 KO THP-1 clone (ATAC-seq).
(D) PMA-differentiated control and IRF1 KO THP-1 clones were stimulated with 10 ng/mL LPS, and chromatin accessibility was assessed using ATAC-seq. For each time point, the DNA sequences within peaks unique to IRF1 KO and Ctrl were assessed for the enrichment of ISRE motifs (see method details). The significance (−log10 p value) of each ISRE motif enrichment in IRF1 KO (y axis) and Ctrl (x axis) is shown.

