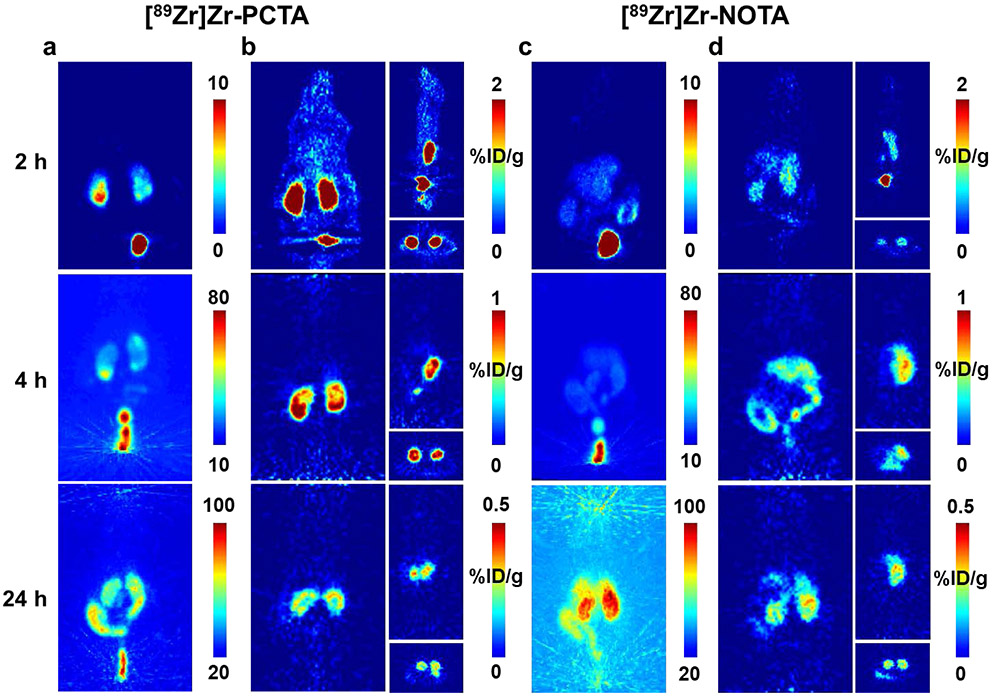
Figure 6.
Representative static PET images of [89Zr]Zr-PCTA and [89Zr]Zr-NOTA over 24 h. Panels a and c represent the maximum intensity projections for each radiometal complex, respectively. Panels b and d represent the coronal (left), sagittal (top right), and transverse (bottom right) views for each radiometal complex, respectively. Rapid clearance is observed at 2 h through bladder and kidneys, with increased accumulation in the kidneys over time and minimal uptake in non-clearance tissues at 24 h.

