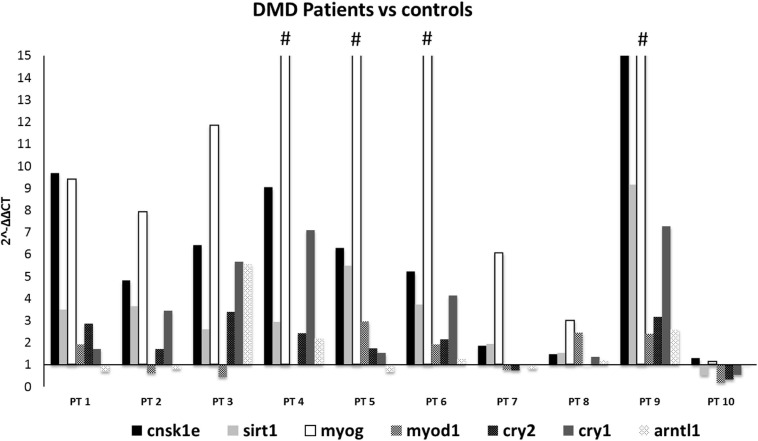
FIGURE 2.
Expression profiling of 7 deregulated genes in muscle samples from DMD patients (n = 10). Note the great upregulation of MYOG. (#): indicates that the expression level of MYOG is more than 15-fold, in PT4:25, PT5:34.7, PT6:43, and PT9:34.7. CSNK1E, SIRT1, and MYOG genes were significantly upregulated in all DMD muscles except for PT8 and PT10.

