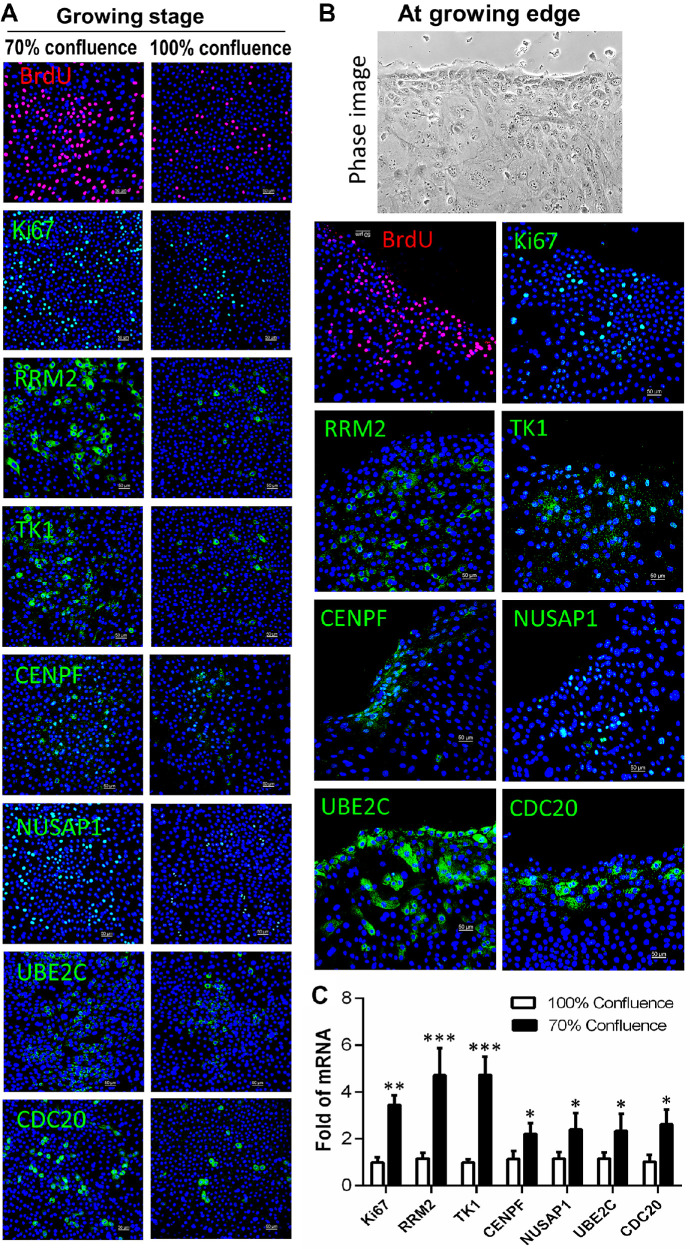
Figure 6.
The expression levels of TAC markers were correlated with cell growing stages in HLECs. (A) Representative images show that the immunoreactivity of BrdU, Ki67, RRM2, TK1, CENPF, NUSAP1, UBE2C, and CDC20 was much stronger in the 70% confluent cells than in the 100% confluent cultures. (B) TAC markers showed different patterns at the edges of growing cells. (C) RT-qPCR showed that these seven genes were expressed at a higher rate in the 70% confluent cultures than in the 100% confluent cultures (n = 5). Data are shown as mean ± SD. *P < 0.05; **P < 0.01; ***P < 0.001.

