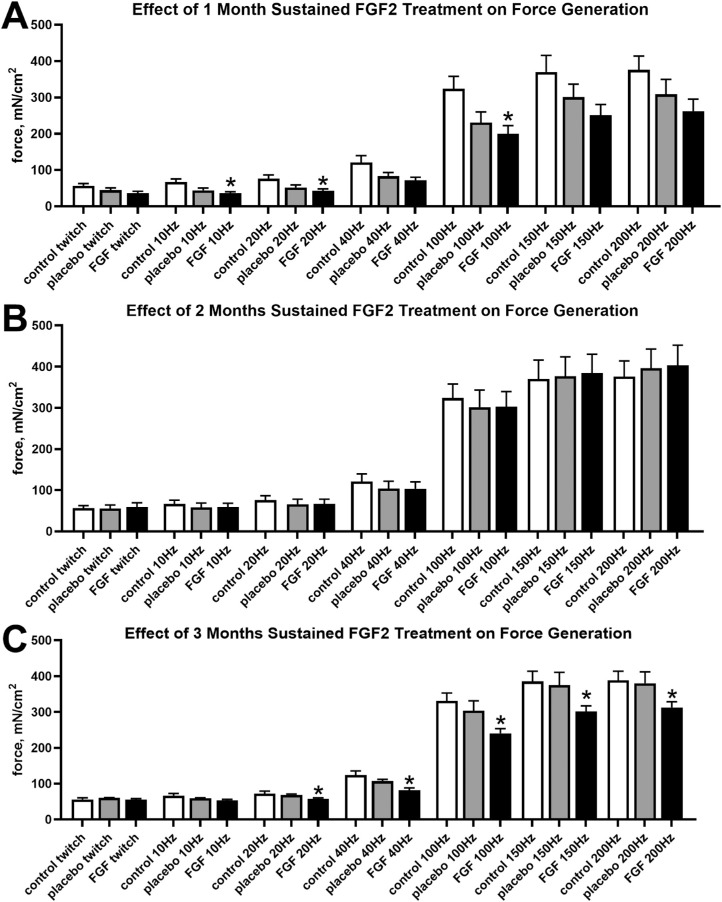
Figure 3.
Force generation (mN/cm2) was quantified for the superior rectus muscles of naïve control, placebo-pellet treated control, and FGF2-pellet treated muscles (A) after 1 month, (B) after 2 months, and (C) after 3 months. * Statistical difference from naïve control superior rectus muscle. # Statistical difference from contralateral superior rectus muscle.

