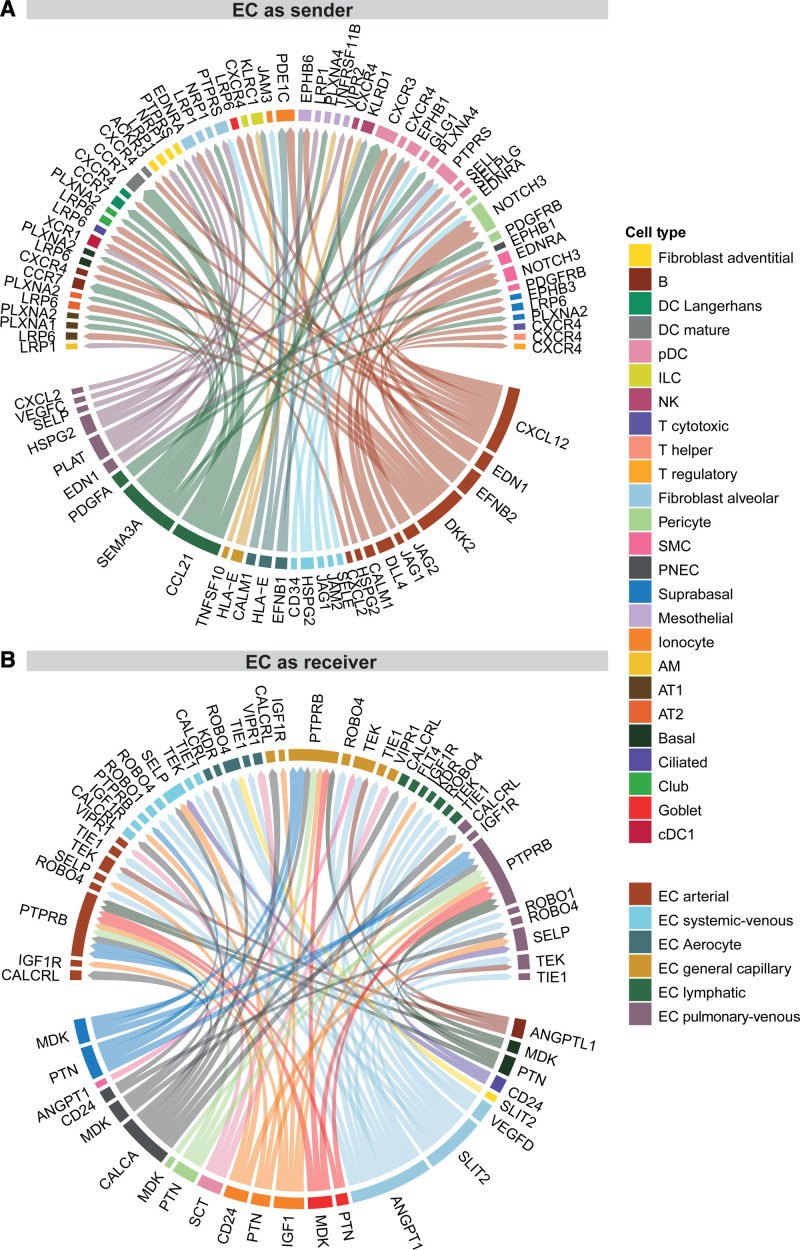
Figure 6.
Endothelial cell (EC)–focused intercellular communication. Visualization of a small subset of the connectomic analysis. Circos plots of top 75 edges by edge weight with EC subpopulations as (A) senders and (B) receivers. Edge thickness is proportional to edge weights. Edge color labels the source cell type. In both Circos plots, ligands occupy the lower semicircle and corresponding receptors the upper semicircle, and ligands and receptors are colored by the expressing cell type. The full results of the connectomic analysis can be found in Table VI. AM indicates alveolar macrophage; AT1/2, alveolar cell type 1/2; cDC1/2, classical dendritic cell type 1/2; cMono, classical monocyte; DC, dendritic cell; ILC, innate lymphoid cell; M, macrophage; ncMono, nonclassical monocyte; NK, natural killer; pDC, plasmacytoid dendritic cell; PNEC, pulmonary neuroendocrine cell; scRNAseq, single cell RNA sequencing; and SMC, smooth muscle cell.

