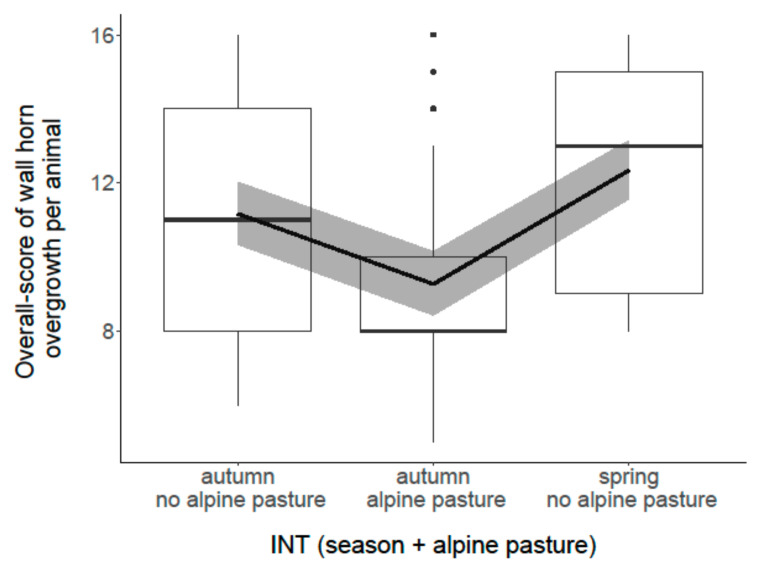
Figure 3.
Association between “overall score of wall horn overgrowth per animal” and the factor “INT (season + alpine pasture)”. Box plot shows medians and interquartiles.. The dots represent outlier data points. The black line represents the model estimate, the gray colored area the 95% confidence interval.

