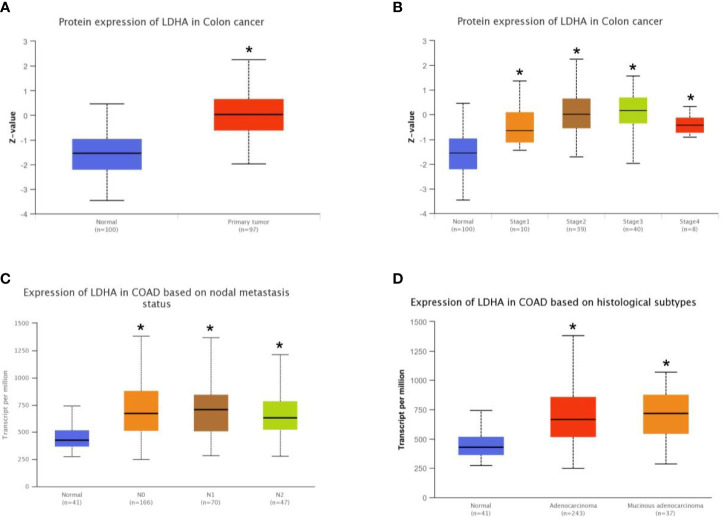
Figure 2.
Correlation of LDHA expression and clinicopathological features of COAD was analyzed using the online database UALCAN. (A) Box plot shows expression of LDHA in COAD and normal patients. (B) Box plot shows relative expression of LDHA in normal individuals or in COAD patients in stages 1, 2, 3, or 4. (C) Box plot shows relative expression of LDHA in normal individuals or in COAD patients in N stages 0, 1, or 2. (D) Box plot shows relative expression of LDHA in normal individuals or in adenocarcinoma or mucinous adenocarcinoma COAD patients. *p < 0.05 compare with control.

