Figure 4.
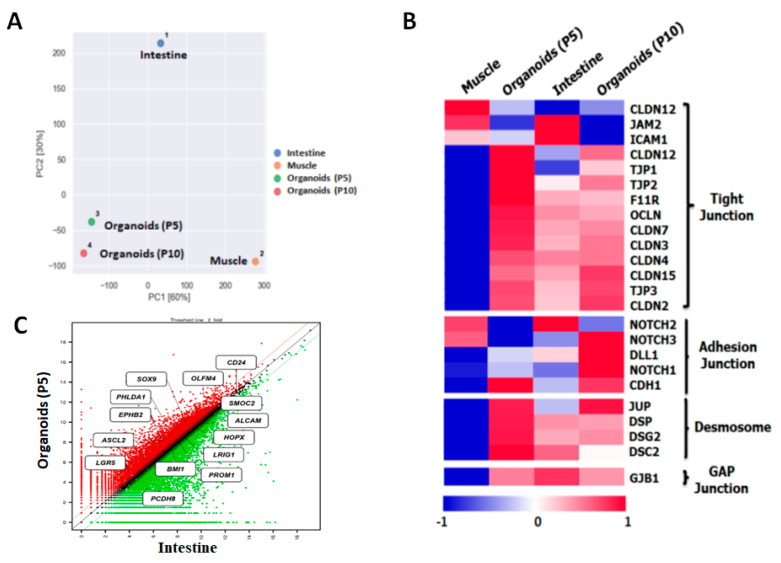
Gene expression profiling of bovine intestinal organoids using QuantSeq 3′ mRNA-Seq. Library: (A) principal component analysis (PCA) of intestinal organoids (P5), intestinal organoids (P10), small intestine, and muscle in bovine. The distance between intestinal organoids and the small intestine was relatively close compared to muscle; (B) heatmap showing many genes in epithelium-characteristic categories such as tight junctions, adherent junctions, desmosomes, and gap junctions. Intestinal organoids at P5 and P10 and in the small intestine were significantly expressed compared to muscle as a control; (C) scatter plot showing many genes related to intestinal stem cell markers such as LGR5, ASCL2, EPHB2, PHLDA1, SOX9, and OLFM4. Intestinal organoids at P5 were significantly upregulated or similar between intestinal organoids and the intestine.

