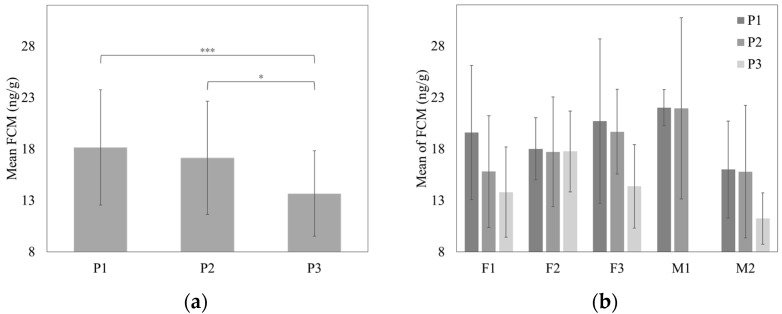
Figure 2.
Plot of means (±SD) of fecal cortisol metabolite (FCM) concentrations before (P1 and P2) and after (P3) the death of the dominant male showing: (a) Group (F1, F2, F3, and M2) means; (b) individual means. Asterisk indicates * p < 0.05 and *** p < 0.001. Abbreviations: F1, female 1; F2, female 2; F3, female 3; M1, male 1; M2, male 2.

