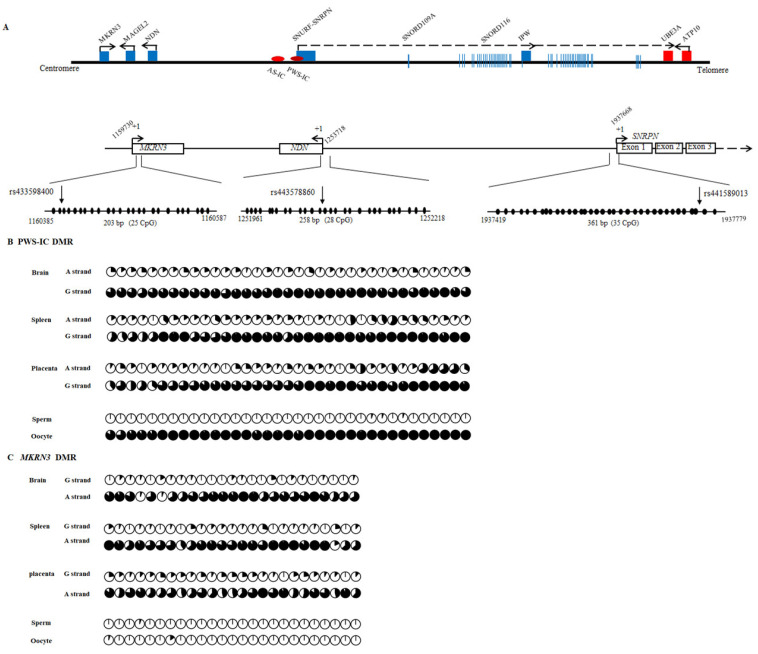
Figure 3.
The structure of bovine PWS/AS imprinted region and the locations and methylation profiles of the PWS-IC, MKRN3 and NDN DMRs in this region. (A) The structure of the PWS/AS imprinted region and the relative location of the PWS-IC, MKRN3 and NDN DMRs in this locus. Maternally and paternally expressed genes are represented by red and blue squares, respectively. The transcription orientation is denoted with an arrow. The SNPs used to determine allele-specific methylation are shown with vertical arrows. (B) DNA methylation profiles of PWS-IC DMR in the brain, spleen, placenta, sperm and oocytes. (C) DNA methylation profiles of MKRN3 DMR in the brain, spleen, placenta, sperm and oocytes. (D) DNA methylation profiles of NDN DMRs in the brain, spleen, placenta, sperm and oocytes. The allele origin of each clone was determined using SNPs in the heterozygous individuals. Methylation of each CpG site is presented with pie charts. The percent of methylated cytosines is represented in black, and the percent of unmethylated cytosines is represented in white at each site. The complete bisulfite maps of PWS-IC, MKRN3 and NDN DMRs may be found in Figure S1.


