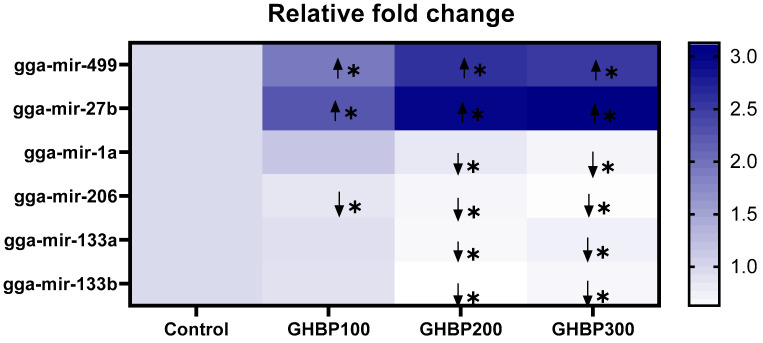
Figure 3.
Heat map for expression of myomiRs (miRs-1a, 133a, 133b, 27b, and 499) in broiler chickens supplied with GHBP at day 38 of age. GHBP: growth hormone-boosting peptide. Data are expressed as means ± SE. Bars with different letters above them correspond to values that were significantly different (p < 0.05). Control: basal diet without GHBP; GHBP100: basal diet plus GHBP at a level of 100 μg/kg; GHBP200: basal diet plus GHBP at a level of 200 μg/kg; GHBP300: basal diet plus GHBP at a level of 300 μg /kg. * Squares correspond to values that are significantly different. Other squares with no (*) denote no significant changes in of miRNA expression among the experimental groups.  Correspond to upregulation of miRNA expression relative to the control group (p < 0.05).
  Correspond to downregulation of miRNA expression relative to control group (p < 0.05).

