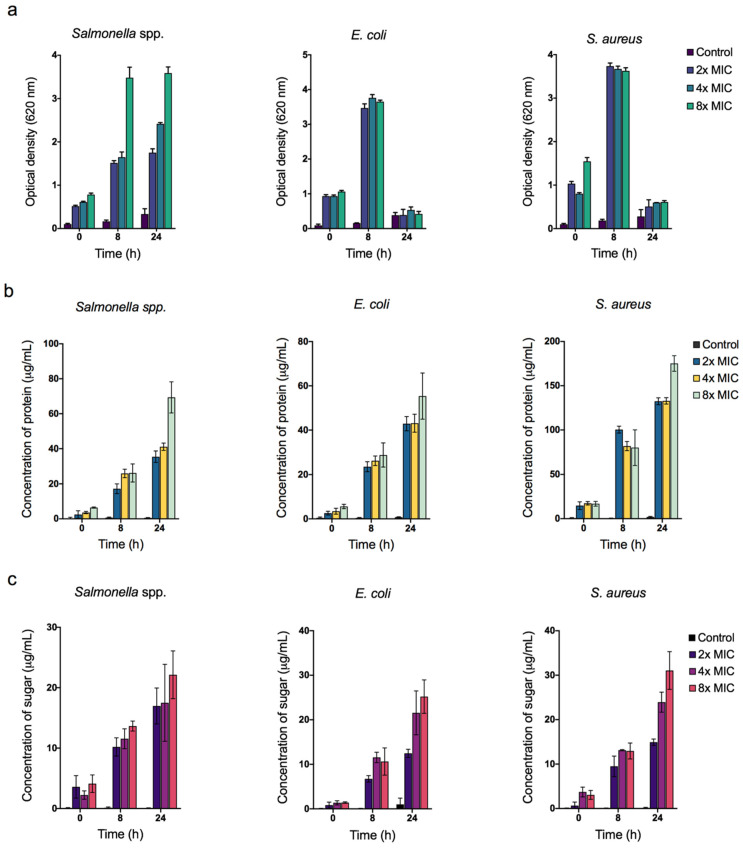
Figure 7.
(a) Reactivity oxygen species (ROS) quantification. Cellular leakage analysis of (b) protein content and (c) reducing sugar from the cell suspensions of Salmonella spp., E. coli, and S. aureus bacteria treated with different concentrations of ZnO NPs at 0, 8, and 24 h of incubation time. Data were shown as the mean ± SD of three replicates.

