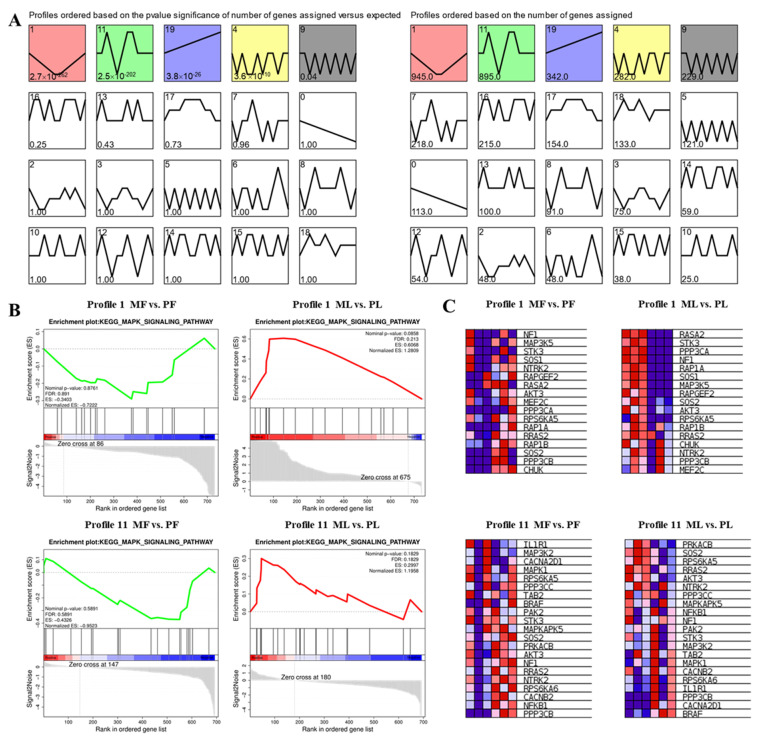
Figure 4.
(A) Trend profiles produced by STEM across two phases. The profiles are placed according to the number of genes assigned. Colored profiles denote that gene expression was significantly enriched in those patterns, with a Q value of ≤0.05. In every pattern, the number of genes is revealed in the upper corner of the profile. (B) GSEA enrichment plots of KEGG signaling pathways. (C) Hierarchical clustering analysis of differential expressed host gene of circRNAs in Profile 1 and 11. Red and blue indicate the high and low expressions, respectively.

