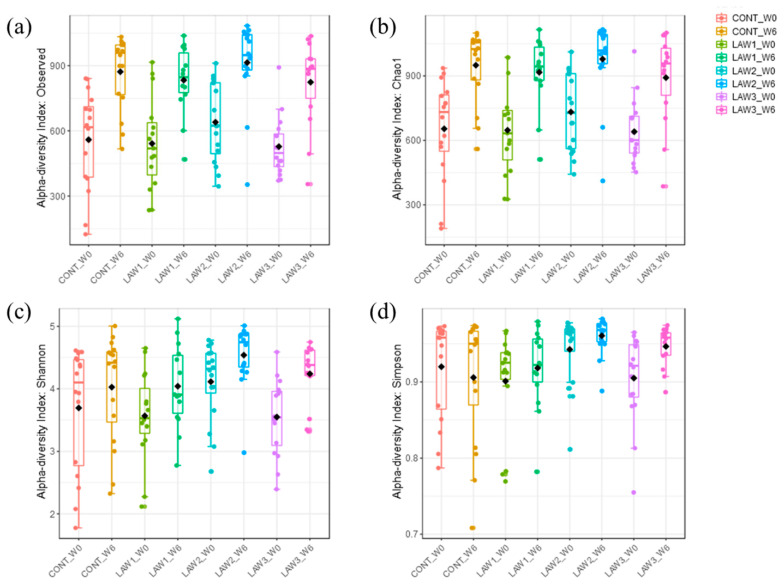
Figure 1.
Box plots showing the alpha diversity indices in gut microbiomes of pigs orally vaccinated with Lawsonia intracellularis vaccine. Species richness were measured using (a) number of observed OTUs and (b) Chao1 diversity index. Species evenness and diversity were measured using (c) Shannon and (d) Simpson diversity indices. Boxes represent the interquartile range (IQR) between the 25th and 75th percentile, and the horizontal line inside the box denotes the median value. Whiskers represent the lowest and highest values within 1.5 times from the 25th and 75th quartiles, respectively. Boxes are colored according to the treatment group and time points as shown in the legend. W0 and W6 denote week 0 and week 6, respectively.

