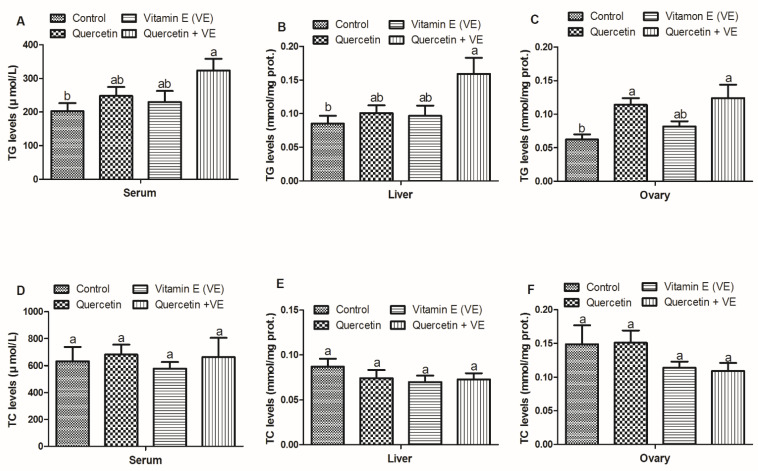
Figure 2.
Effects of quercetin, vitamin E, and quercetin + vitamin E on the triglyceride (TG) and total cholesterol (TC) levels in the liver, serum, and ovary of the aging breeder hens. Figure 2: Levels of TG (A–C) and TC (D–F). The values are presented as the mean ± SD. Bars without the same letter differed significantly (p < 0.05). prot: protein.

