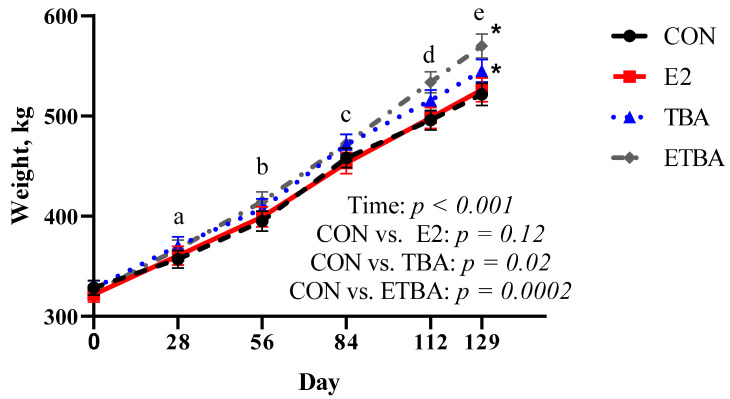
Figure 1.
Weights were measured as described in the Materials and Methods. Steers were initially stratified by weight and assigned to one of four treatments: (1) estradiol (E2) only implant containing 25.7 mg E2 (n = 12; Compudose, Elanco Animal Health), (2) trenbolone acetate (TBA) only implant containing 200 mg TBA (n = 12; Finaplix-H, Merck Animal Health), (3) a combined estradiol and trenbolone acetate (ETBA) implant containing 120 mg TBA and 24 mg E2 (n = 13, Revalor-S, Merck Animal Health), or (4) no implant (CON; n = 13). Different letters indicate a difference (p ≤ 0.05) in weights between the time points. Contrasts were used to compare differences in weight gain over time between treatment and the control. The p-values for this analysis are displayed on the figure. The * indicates a difference (p < 0.05) between that treatment and the CON steers when analyzed as a repeated measure over time. All data are reported as LSMEANS ± SEM.

