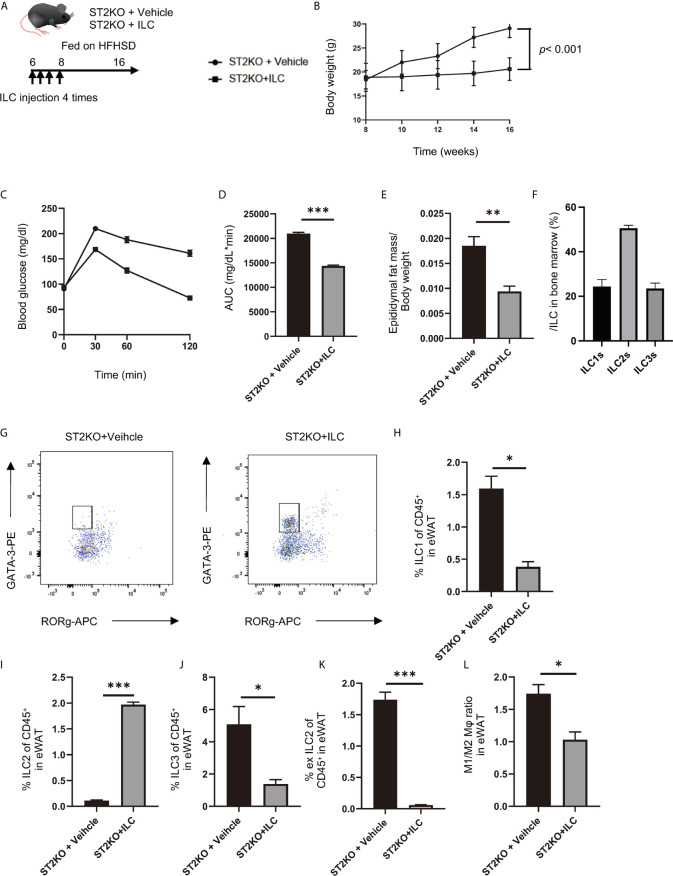
Figure 5.
Adoptive transfer of ILCs from WT mice bone marrow improved glucose tolerance in ST2KO mice. (A) The adoptive transfer was performed four times within two weeks from the first injection into 6-week old mice. The total number of ILCs injected into ST2KO mice was 8–10 × 105 cells/mouse/experiment. The 8-week old mice were placed on a HFHSD on the last day that ILCs were transferred. (B) Body weight changes (n = 6) are shown. (C, D) When the mice reached 20 weeks of age, an intraperitoneal glucose tolerance test (iPGTT) (2 g/kg body weight) was performed, and the data’s area under the curve (AUC) was analyzed (n = 6). (E) The ratio of epididymal fat mass to body weight (n = 6) is shown. (F) The ratio of ILCs in bone marrow is shown (n = 6). (G) Representative flow cytometry plots of epididymal white adipose tissue (eWAT) CD45+ Live and Dead-Lin-CD127+ RORg-GATA-3+ ILC2s at 20 weeks of age. (H) The ratio of ILC1s to CD45 positive cells in eWAT (n = 6). (I) The ratio of ILC2s to CD45-positive cells in eWAT (n = 6). (J) The ratio of ILC3s to CD45-positive cells in eWAT (n = 6). (K) The ratio of ex-ILC2s to CD45-positive cells in eWAT (n = 6). (L) The ratio of M1 macrophages in M2 macrophages in eWAT (n = 6). Data are represented as mean ± SD; *p < 0.05, **p < 0.01, ***p < 0.001 by one-way ANOVA test.

