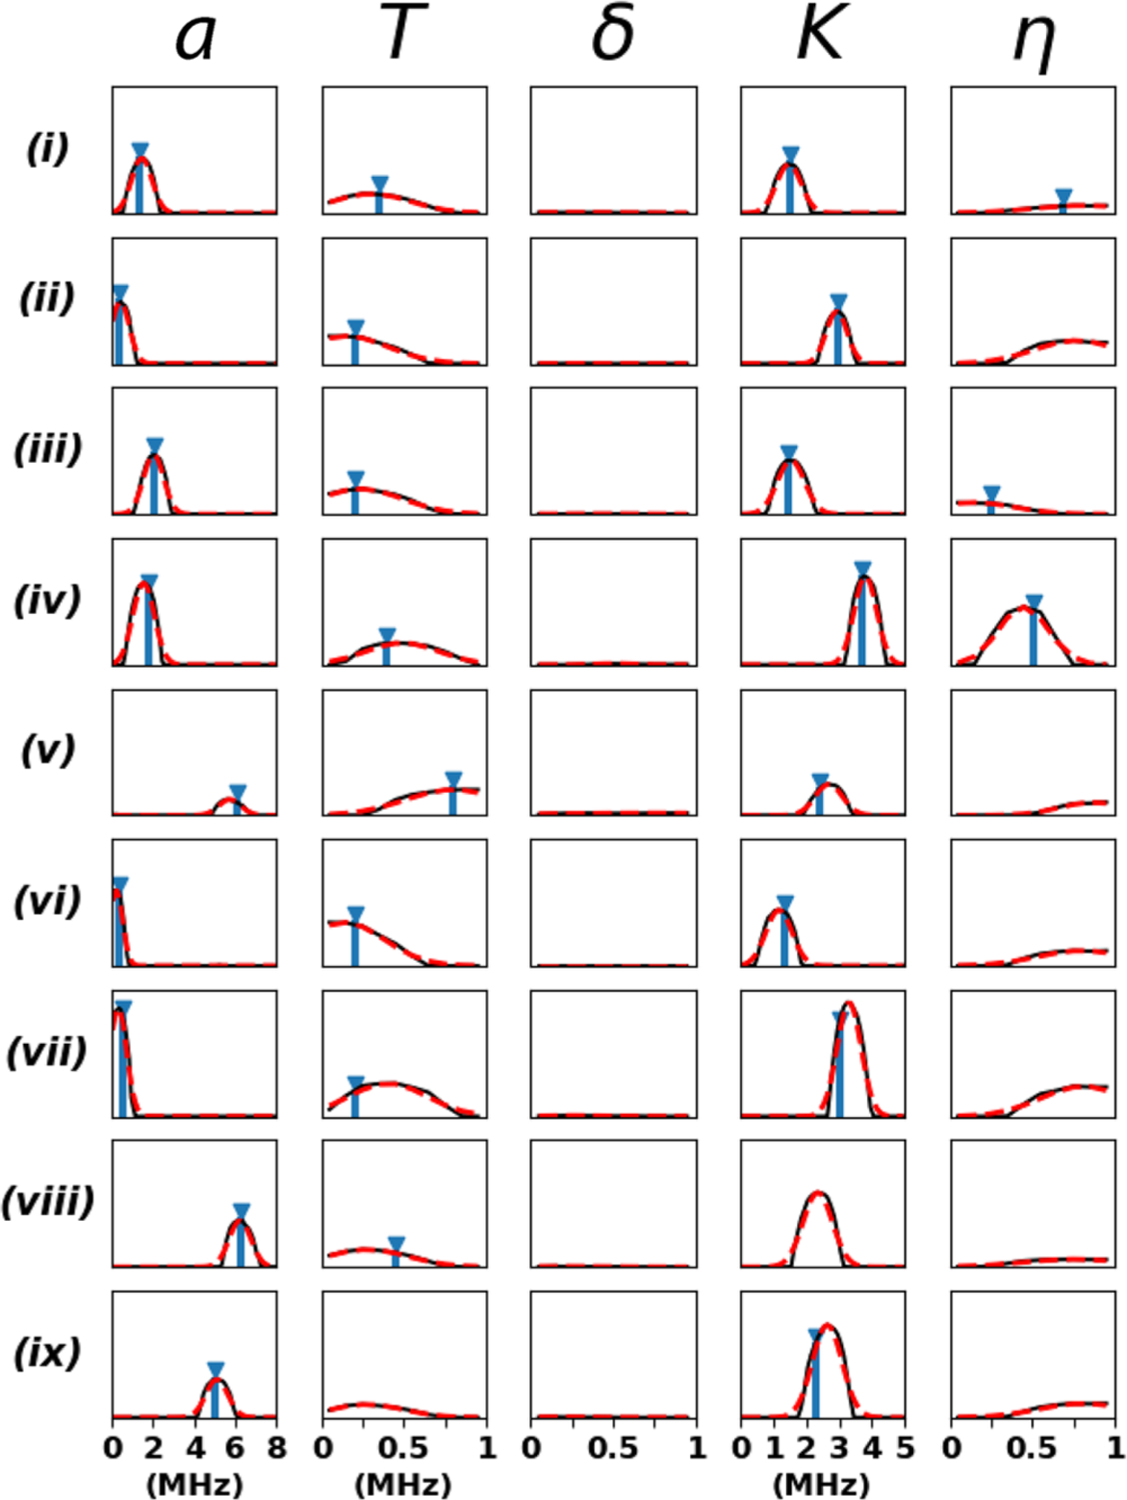
Figure 3.

Comparison of the CNN probability distributions for a, T, δ, K, and η (black) with the previously reported literature values (blue) where available: (i) SQB RC (L-H190-Nδ) – semiquinone (SQ) in the QB ubiquinone binding site of the reaction center from Rhodobacter sphaeroides interacting with Nδ of residue L-H190;21 (ii) SQB RC (L-G225-Np) – same as previous for Np of L-G225;21 (iii) SQH cyt aa3 (H70-Nε) – SQ in the QH high-affinity menaquinone binding site of the R70H mutant of cytochrome aa3-600 menaquinol oxidase from Bacillus subtilis interacting with Nε of residue H70;22 (iv) SQH cyt bo3 (R71-Nε) – semiquinone in the QH high-affinity ubiquinone binding site of the cytochrome bo3 ubiquinol oxidase from Escherichia coli interacting with Nε of residue R71;23 (v) [2Fe-2S] rat mitoNEET (H87-Nδ) – reduced [2Fe-2S](Cys)3(His)1 cluster in rat mitoNEET interacting with Nδ of residue H87;24 (vi) [2Fe-2S] rat mitoNEET (H87-Nε) – same as previous for Nε of residue H87;24 [2Fe-2S] rat mitoNEET (Np) – same as previous for Np in the cluster environment;24 (viii) VO2+ (Imidazole) – VO2+ ion interaction with coordinating imidazole ligand nitrogens;25 and (ix) VO2+ (Histidine-Nα)2 – VO2+ ion interaction with coordinating NαH2 of histidine ligands.25 The final predictions and their standard deviation errors are determined by a Gaussian fit to the probability distributions (dashed red). It took ∼3 s for the machine learning algorithm to process the time-domain patterns and generate this figure on a desktop equipped with an Intel Core i5–4570 processor (3.2 GHz) and 16 GB of RAM.
