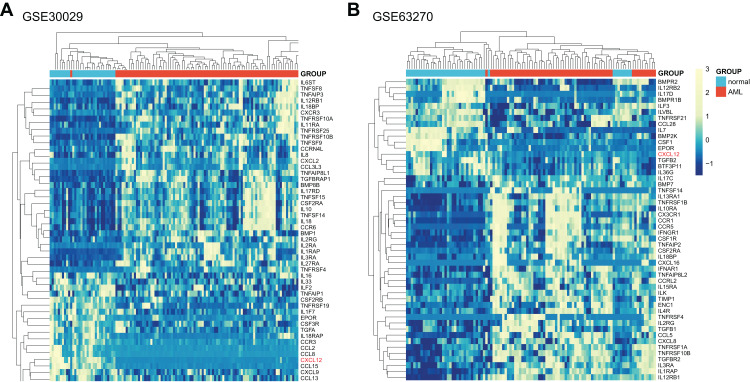
Figure 1. Expression heat map of differentially expressed cytokine and cytokine receptor genes between AML patients and normal controls.
(A) Differentially expressed genes between AML patients and normal controls in GSE30029. (B) Differentially expressed genes between AML patients and normal controls in GSE63270. Only the top 50 genes were shown if adjusted p-value < 0.05 and |logFC| > 0.

