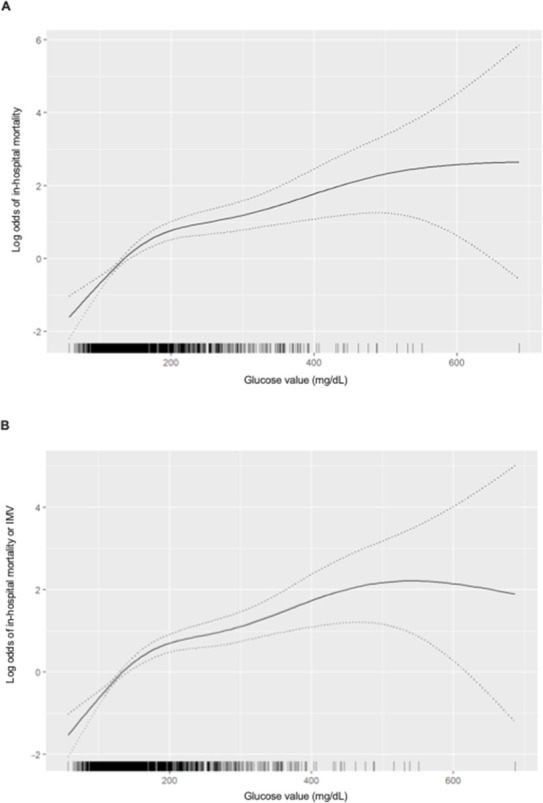
Figure 5.

Spline plot demonstrating a marked non-linearity in the relationship between plasma glucose (mg/dL) levels on admission and the log odds of death (A) and death or invasive mechanical ventilation (IMV) rate (B). Tick marks above the horizontal axis indicate the values at which the observations were made. The dotted lines represent the 95% CI. The model was adjusted for age, sex, obesity, hypertension, hyperlipidaemia, history of CVD, HF, CKD and COPD. CKD, chronic kidney disease; COPD, chronic obstructive pulmonary disease; CVD, cardiovascular disease; HF, heart failure.
