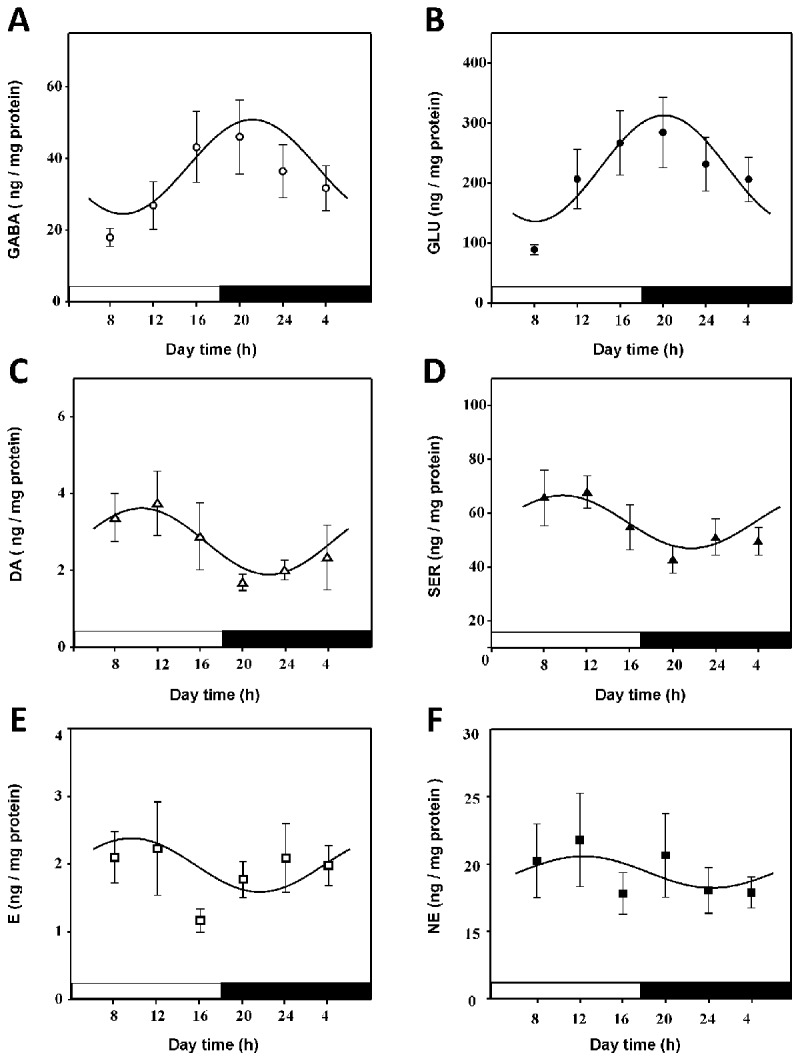
Figure 1.

Changes in neurotransmitter levels in the lumbar spinal cord of rats during a light-dark cycle. A) Gamma-aminobutyric acid (GABA; open circles), B) glutamate (GLU; closed circles), C) dopamine (DA; open triangles), D) serotonin (SER; closed triangles), E) epinephrine (E; open squares) and F) norepinephrine (NE; closed squares). Values are the mean ± S.E.M. for 8–10 rats. Cosinor fitting was significant in the GABA, GLU, DA, and SER concentration curves and experimental data (F test, p < 0.001) but not for the E and NE curves. The bar on the X axis indicates the light and dark periods.
