
Figure 2.
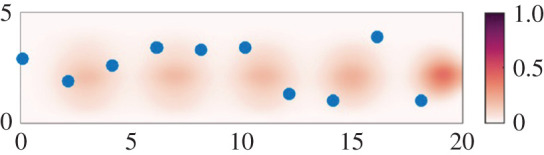
Image showing the mixing of individual clouds of infected aerosol, dyed different shades of red and normalized relative to the initial concentration as seen on the legend. The corridor is 5 m wide (y-axis) and 20 m long (x-axis), with people (blue dots) moving from left to right along the corridor. In this simulation, the along-corridor people spacing is 2 m and they move with speed 1.5 m s−1, while the clouds of aerosol are produced by one person moving down the corridor,so the older cloud at the left-hand end of the corridor is more dispersed than that on the right (calculations by Bhamidipati and Woods based on [70]). (Online version in colour.)