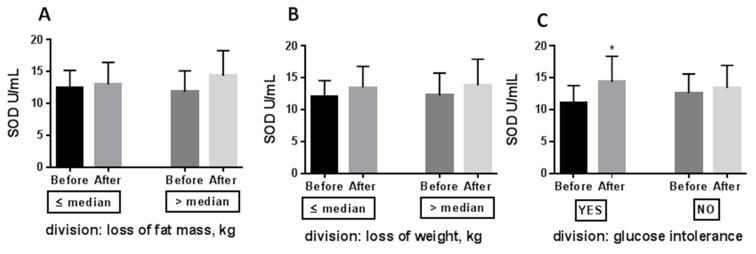
Figure 4.
Effect of 8 weeks caloric restriction on serum superoxide dismutase (panel A–C). Patients after caloric restriction were divided according to the median value regarding the fat mass loss, the bodyweight loss, and the glucose concentration after 2h of OGTT at baseline. The data were analysed using the paired/unpaired t-tests depending on Gaussian/ non-Gaussian distribution. Significance difference Before vs. After: * p < 0.05. Abbreviations: SOD—superoxide dismutase.

