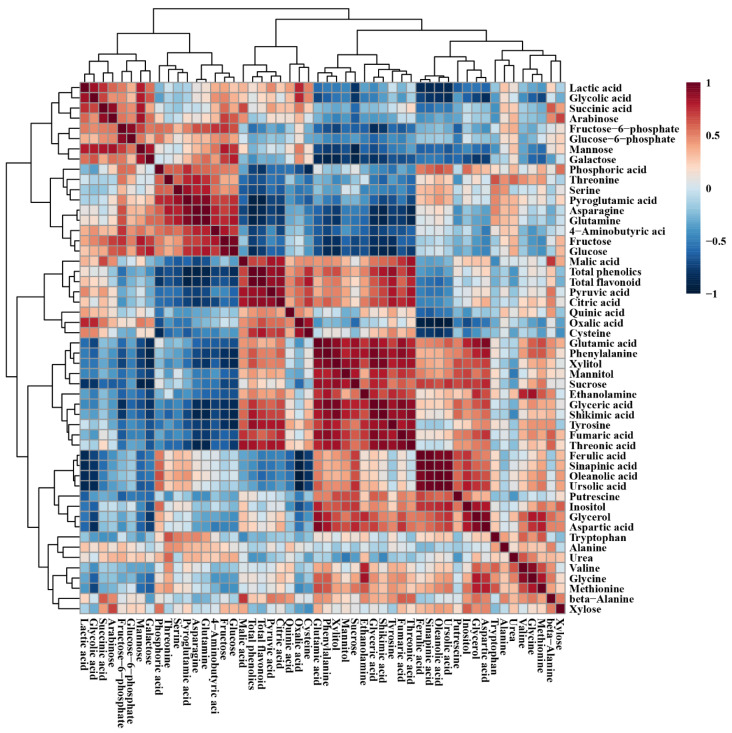
Figure 6.
Correlation matrix of metabolites detected in different organs of L. pubescens. Each square indicates the Pearson’s correlation coefficient of a pair of compounds, and the value of the correlation coefficient is represented by the intensity of blue or red colors, as indicated on the color scale.

