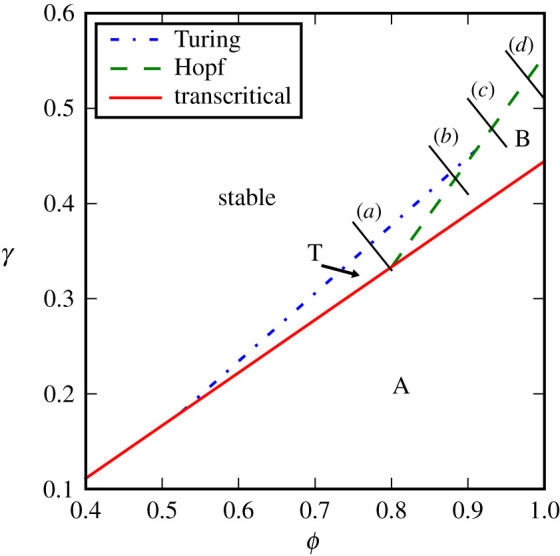
Figure 2.

Bifurcation diagram of the predator-prey system on the six patches topology. Stability of the state under consideration changes in response to changes in the sensitivity of biomass production to producer biomass ϕ and the sensitivity of predation to prey biomass γ. The state under consideration is stable in the top left area. Stability is lost when either of three bifurcations occur (Turing, transcritical, Hopf). After the loss of stability the system approaches a state of homogeneous oscillations (A), a different homogeneous stationary state (B), or a state of stationary patterns (T). The bifurcation diagram was computed using the master stability function approach from [30] (see electronic supplementary material). It corresponds directly to Fig. 1 from [35] which studies a predator-prey system in continuous space. Lines (a–d) indicate the transects used for the corresponding simulations in figure 3. (Online version in colour.)
