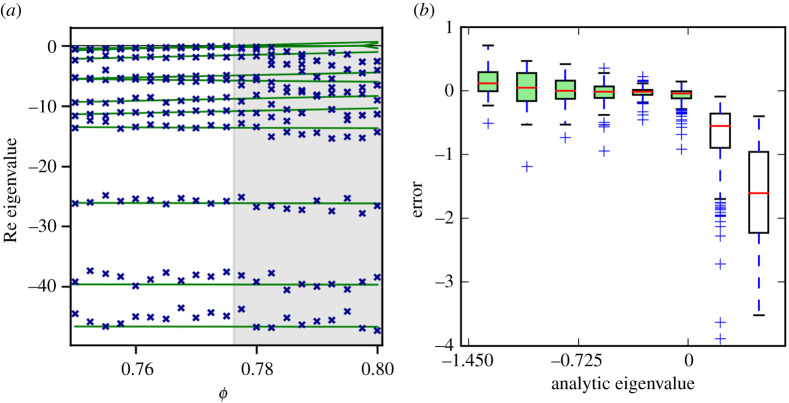
Figure 4.
Accuracy of the eigenvalue estimation. (a) Comparison of analytic (lines) and reconstructed (crosses) eigenvalues shows that the reconstruction performs well in the stable region (white background) and yields comparable relative error for all eigenvalues. Once stability is lost (shaded region) the system departs from the analytical steady state, hence a discrepancy in the eigenvalues appears. (Parameters as in figure 3a). (b) For a closer analysis of the accuracy of the leading eigenvalue, we repeated the analysis of figure 3 three times and plot the deviation of the reconstructed eigenvalue depending on the analytic eigenvalue. The accuracy approves significantly as we approach the bifurcation point. After destabilization large errors appear that are due to the departure from the benchmark state, rather than inaccuracies in the reconstruction. (Online version in colour.)

