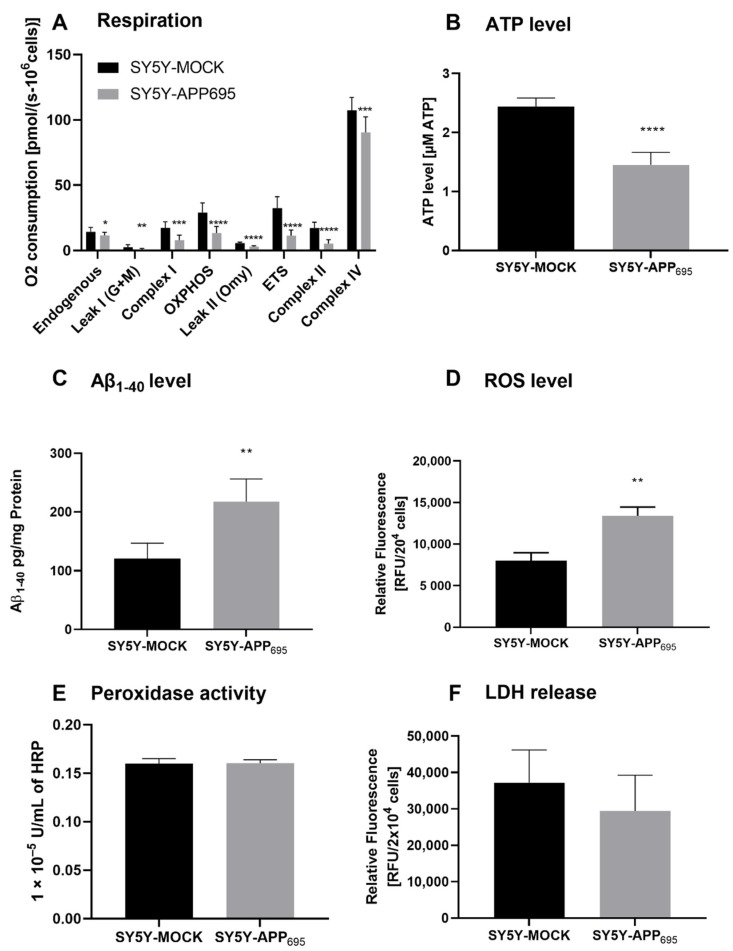
Figure 1.
Respiration, ATP, Aβ1-40 level, ROS level, and peroxidase activity of SH-SY5Y-APP695 cells compared to SH-SY5Y-MOCK cells. (A) Respiration of SH-SY5Y-MOCK and -APP cells adjusted to cell count. Respective mean values ± SD are shown. *p < 0.05, **p < 0.01, ***p < 0.001, and **** p < 0.0001. Significance was determined by Student’s unpaired t-test, N = 12. (B) SH-SY5Y-APP695 cells exhibit reduced ATP levels compared to SH-SY5Y-MOCk control cells. ATP levels were determined after 24 h seeding by bioluminescence assay. Respective mean values ± SD are shown. Significance was determined by Student´s unpaired t-test (****p < 0.0001), N = 8. (C) Concentration of Aβ1-40 levels in SH-SY5Y-APP695 cells compared to SH-SY5Y-MOCK cells. ** p < 0.01. Significance was determined by Student’s unpaired t-test. N = 6. (D) ROS levels in RUF/204 cells in SH-SY5Y-APP695 cells compared to SH-SY5Y-MOCK cells. Respective mean values ± SD are shown. Significance was determined by Student´s unpaired t-test (*** p < 0.001), N = 8. (E) Peroxidase activity in SH-SY5Y-MOCK cells compared to -APP696 cells. Respective mean values ± SD are shown. Significance was determined by Student´s unpaired t-test, N = 8. (F) Membrane integrity by LDH release level in RUF/204 cells in SH-SY5Y-APP695 cells compared to SH-SY5Y-MOCK cells. Respective mean values ± SD are shown, N = 4.

