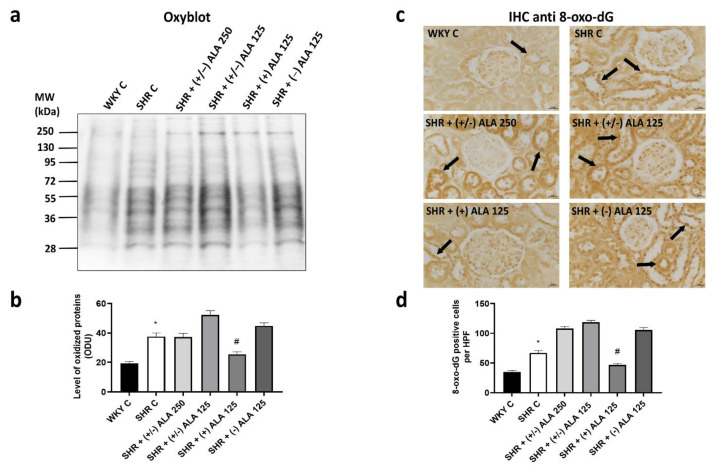
Figure 1.
Oxidative stress in the kidney. (a) Lysates of kidney from WKY C, SHR C, SHR (+/−)-alpha-lipoic acid (ALA) 250 µmol/kg/day, SHR + (+/−) ALA 125 µmol/kg/day, SHR + (+) ALA 125 µmol/kg/day, SHR + (−) ALA 125 µmol/kg/day were immunoblotted using the Oxyblot kit; (b) The bar graph reports the level of oxidized proteins measured in optical density unit (ODU); (c) Sections of kidney processed for the 8-oxo-dG immunohistochemistry (IHC). Arrow: positive nucleus. Calibration bar 25 µm; (d) The bar graph shows the quantification of the number of positive cells per high-power field (HPF) (40×). Data are mean ± S.E.M. * p < 0.05 vs. WKY C; # p < 0.05 vs. SHR C.

