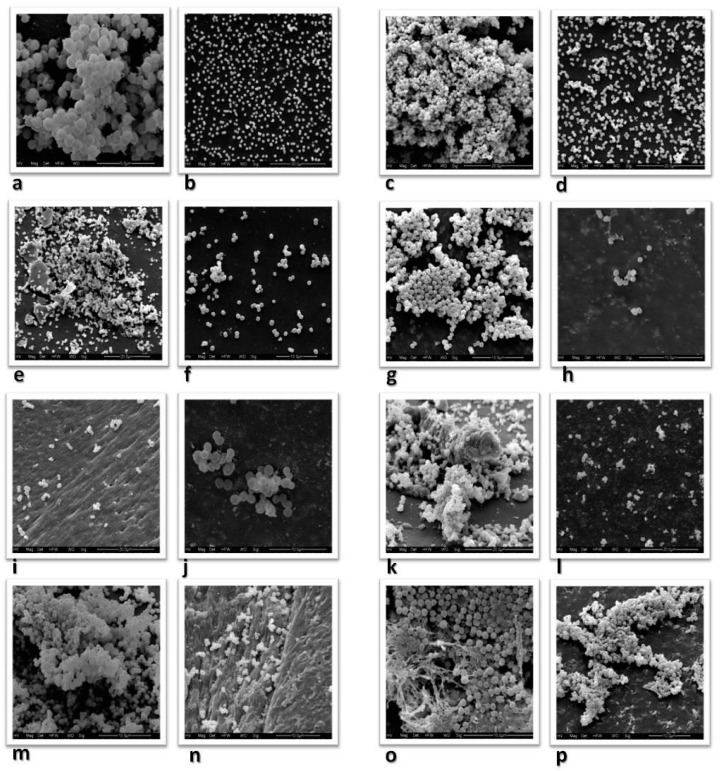
Figure 3.
(a,b): SEM results for the same S. saprophyticus isolate: (a): pure culture; (b): S. saprophyticus isolate incubated with 200 µg/mL RIP. (c,d): S. epidermidis ADBC carrying the complete operon; (c): pure culture; (d): S. epidermidis incubated with 200 µg/mL RIP. (e,f): S. epidermidis DBC carrying the icaDBC genes; (e): pure culture; (f): S. epidermidis incubated with 200 µg/mL RIP. (g,h): S. haemolyticus A expressing only the icaA gene; (g): pure culture; (h): S. haemolyticus incubated with 200 µg/mL RIP. (i,j): SEM results for the same S. hominis isolate; (i): pure culture; (j): S. hominis incubated with 200 µg/mL RIP. (k,l): SEM results for the same S. warneri isolate; (k): pure culture; (l): S. warneri incubated with 200 µg/mL RIP. (m,n): SEM results for S. lugdunensis: (m): pure culture; (n): S. lugdunensis incubated with 200 µg/mL RIP. (o,p): SEM results for the same S. aureus isolate: (o): pure culture; (p): S. aureus incubated with 200 µg/mL RIP. Scale bars: (a,b): 10 µm; (c,d,k–p): 20 µm; (e–h): 10 µm; (i,j): 5 µm.

