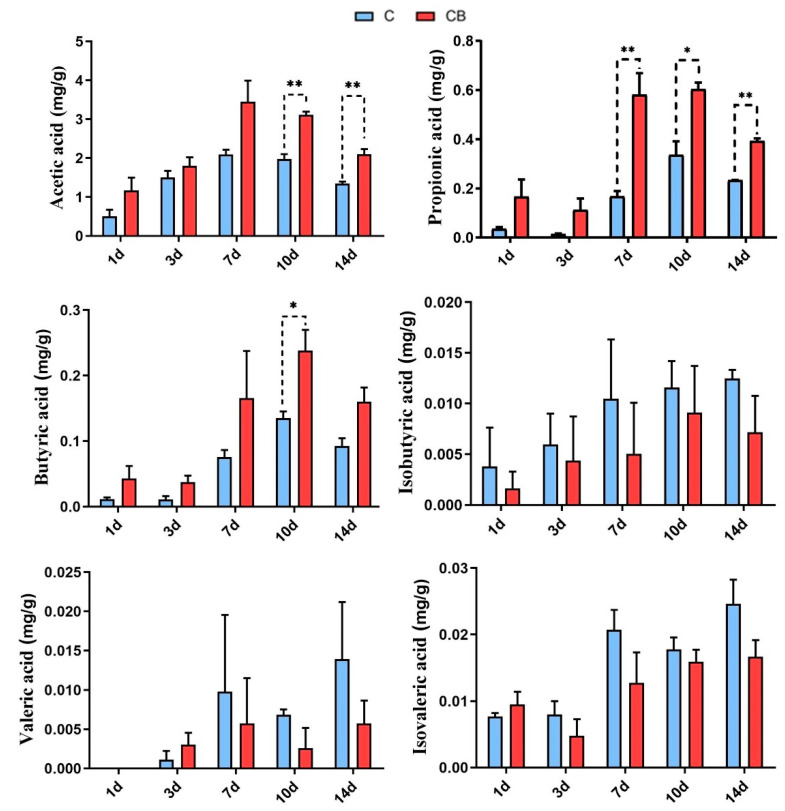
Figure 8.
The concentrations of short-chain fatty acids (SCFAs) in the cecum of the Muscovy ducks in the C group and the CB group. Data were expressed as the mean ± SD (n = 8). Differences between the C and CB groups at each time point were analyzed by the unpaired two-tailed Student’s t-test. * p < 0.05, ** p < 0.01. C group, control group; CB group, C. butyricum group. 1d, 3d, 7d, 10d, and 14d represent 1st day, 3rd day, 7th day, 10th day, and 14th day of the present experiment, respectively.

