Figure 5.
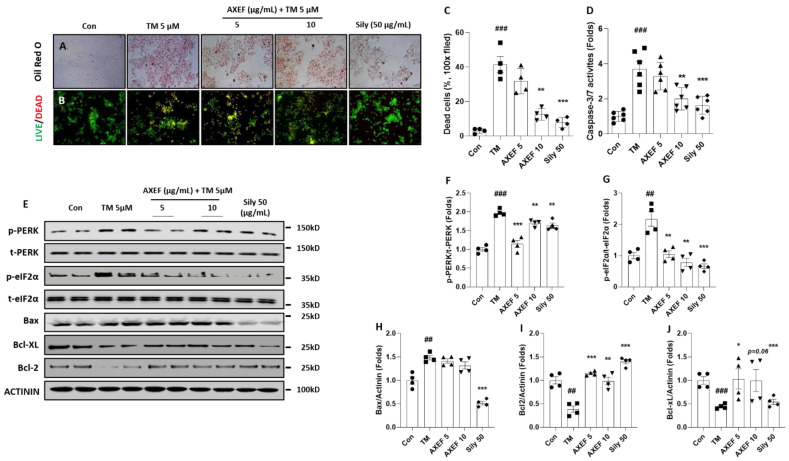
Effects of AXEF on the ER stress-induced in vitro NASH model of cellular damage. (A) Oil Red O staining of Huh7 cells of TM-induced (5 µM) ER stress in vitro NASH model using treatment and (B) LIVE/DEAD cell assays. (C) Quantitative analysis of LIVE/DEAD cell assay. (D) Cellular levels of caspase-3/7 activity. (E) Western blot analysis of ER stress and apoptosis-related molecules from Huh7 cell lysate. (F–J) Data are expressed as the mean ± SD (n = 4 for Oil Red O staining; n = 6–8 for caspase-3/7 activities). ## p < 0.01; ### p < 0.001 for the Con vs. TM, * p < 0.05; ** p < 0.01; *** p < 0.001 for TM vs. AXEF or Sily 50. Images were captured using light microscopy (100× magnification) or fluorescence filter equipped microscope (100× magnification).

