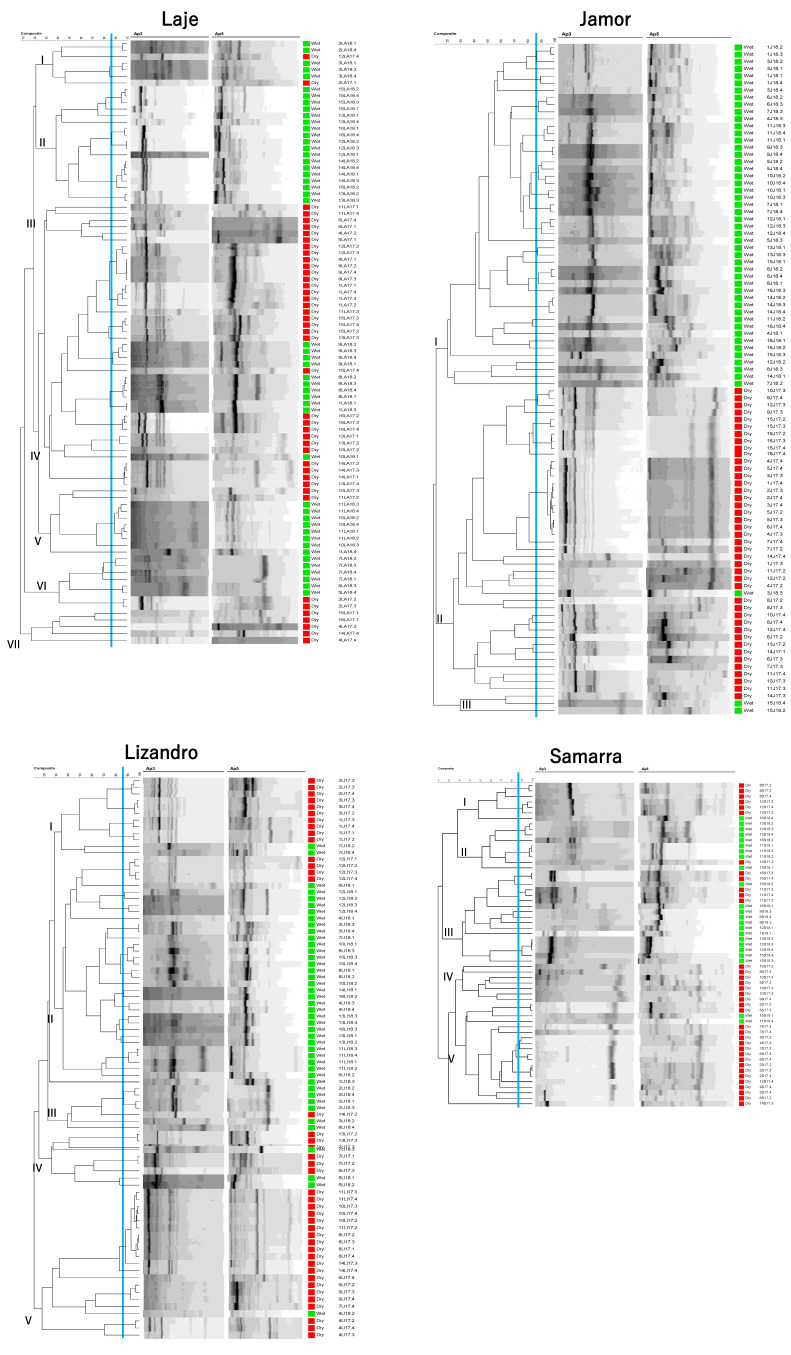
Figure 5.
Dendrograms of isolates based on the composite analysis of RAPD fingerprints with primers Ap3 and Ap5 (Pearson correlation coefficient and UPGMA clustering) from each of the sampling locations. Cophenetic correlation coefficients are as follows: Lizandro—0.85, Samarra—0.86, Laje—0.83, Jamor—0.87. Differential coloration represents sampling season in which the isolate was collected: Red—Dry Season; Green—Wet Season.

