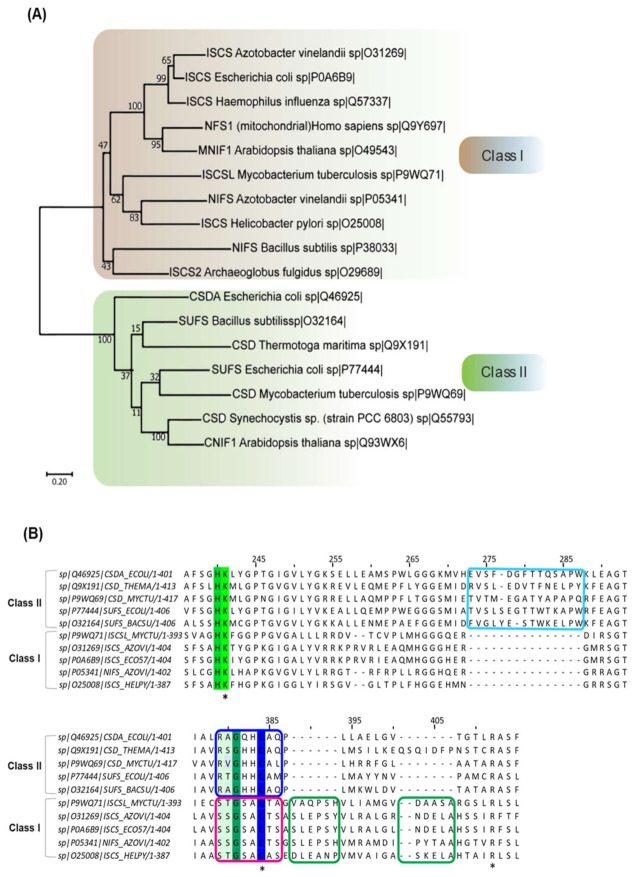
Figure 1.
Phylogenetic analysis of CSD enzymes of organisms from different domains. (A) Maximum likelihood phylogenetic reconstruction of 17 CSD homologs from organisms spanning throughout three domains: Eukarya, Bacteria, and Archaea. Evolutionary analysis performed in MEGA X [42]. The CSD homologs are seen to cluster into two main branches, which can be determined as Class I and II. This tree has a maximum log-likelihood of −13398.96. The scale bar shows genetic distance. Bootstrap values (500 replicates) shown next to the branches. (B) Multiple sequence alignment of different bacterial CSD homologs. CSDs are indicated as UniProt ID. The green-highlighted lysine (K)-residue is the highly conserved PLP-coordinating residue, while the cyan box highlights the sequence insertion acquired by the Class II CSDs. The green boxes focus on the sequence insertion inherent to the Class I CSDs, whereas the blue and pink box features the differences in the sequences adjacent to the active site cysteine. Conserved lysine, cysteine and arginine residue are indicated by “*”.

