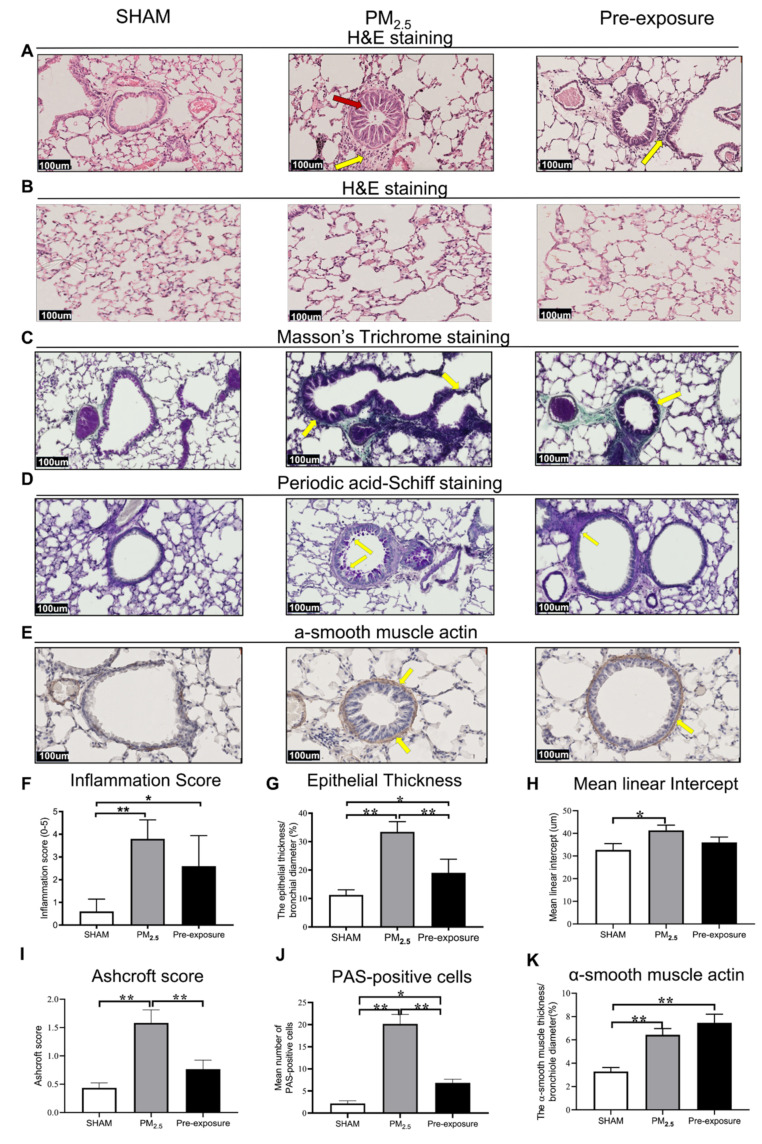
Figure 3.
PM2.5 exposure induced lung tissue remodelling in the dams. Representative images of lung sections stained with H&E staining of (A) the airway (yellow arrows point at immune cells and red arrow point at the enlarged epithelium in the bronchiole) and (B) parenchyma; (C) Masson’s trichrome staining (yellow arrows point at collagen); (D) Periodic acid-Schiff staining, with yellow arrows pointing at goblet cells; and (E) α-smooth muscle actin (yellow arrows point at α-smooth muscle actin positive cells). Quantitative results of (F) inflammation score, (G) epithelial thickness, (H) mean linear intercept, (I) Ashcroft score, (J) PAS-positive cells and (K) α-smooth muscle actin. Data were analysed by one-way ANOVA followed by Fisher’s LSD post hoc tests. n = 8. * p < 0.05, ** p < 0.01. PM2.5: dams exposed to PM2.5 (5 µg/day) prior to mating for 6 weeks during gestation and lactation. Pre-exposure: dams exposed to PM2.5 for 6 weeks prior to mating.

