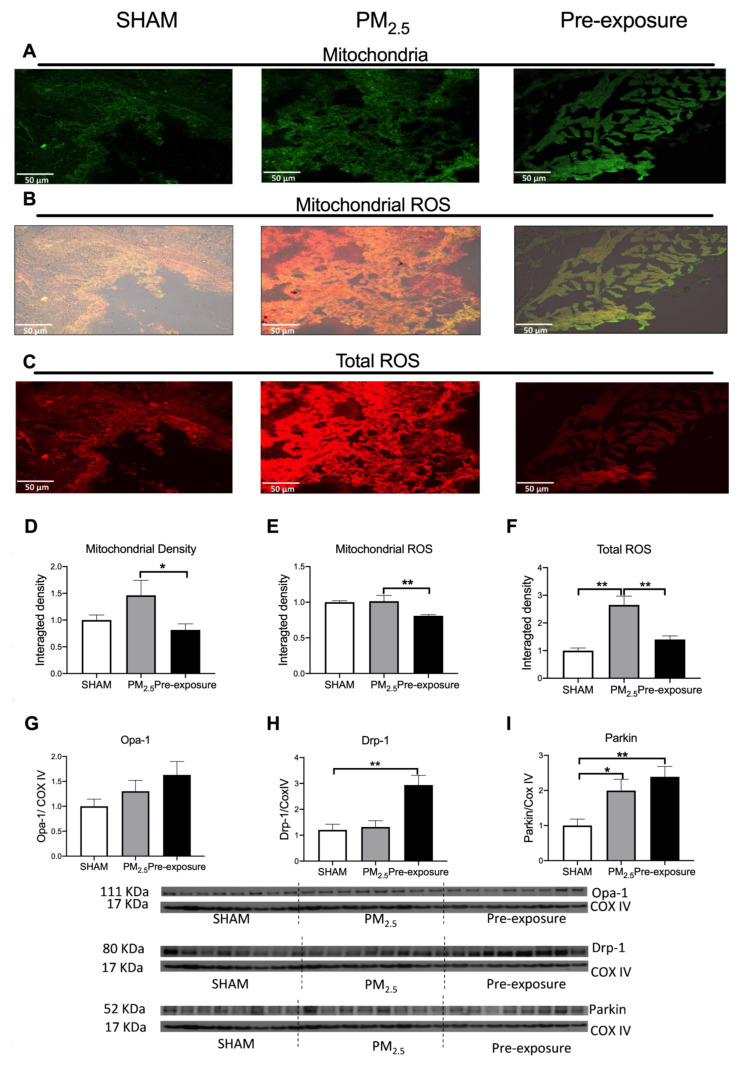
Figure 4.
PM2.5 exposure increased mitochondrial density and total ROS level in the dams. Representative images of (A) mitochondria (green), (B) mitochondrial specific ROS (orange,) and (C) total ROS (red) staining, and (D–F) quantitative results. Protein levels of (G) Opa-1, (H) Drp-1 and (I) Parkin. Data were analysed by one-way ANOVA followed by Fisher’s LSD post hoc tests. N = 5 in mitochondrial fluorescence staining, n = 8 in Western blot. * p < 0.05, ** p < 0.01. Drp-1, dynamin-related protein; Opa-1, optic atrophy-1; PM2.5: dams exposed to PM2.5 (5 µg/day) prior to mating for 6 weeks during gestation and lactation. Pre-exposure: dams exposed to PM2.5 for 6 weeks prior to mating.

