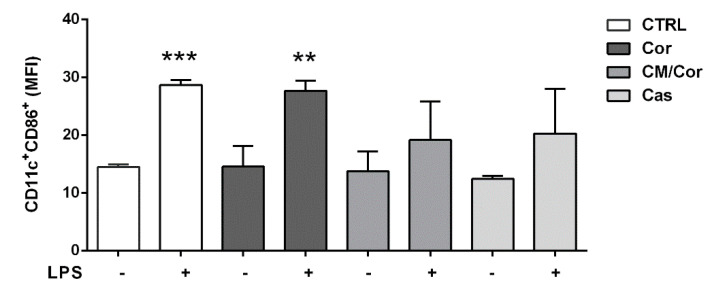
Figure 3.
EVOO extracts differently modulate the expression of CD86 costimulatory molecule based on their chemical composition. The bars represent CD86 cell surface expression calculated on CD11c+ gated cells at basal conditions and 24 h after LPS stimulation. Data are expressed as a mean value of Median Fluorescence Index (MFI) ± SEM (n = 3) of untreated (Ctrl) and treated BMDCs with different EVOO extracts (12.5 µg/mL). Statistical significance was calculated for each treatment (Ctrl and Cor-CM/Cor-Cas EVOO extracts) vs. the relative unstimulated sample. ** p < 0.001, *** p < 0.0001.

