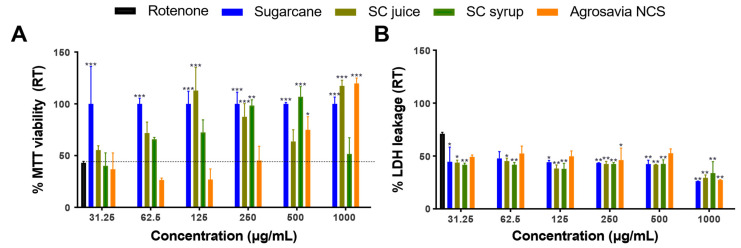
Figure 2.
Recovery effect in a rotenone PD-induced model (RT) exposed to SC derivatives. (A) Cell viability as determined via MTT. The rotenone effect is highlighted by the horizontal black dotted line. (B) Cell membrane integrity determined via LDH released. The percentages were calculated as described in Material and Methods. The LDH released for the rotenone-induced control was 70 ± 0.79%. Results are presented as mean ± SEM of three independent experiments. Two-way ANOVA test was used to assess statistical significances * (p-value ≤ 0.05), ** (p-value ≤ 0.01) and *** (p-value ≤ 0.001).

