Figure 3.
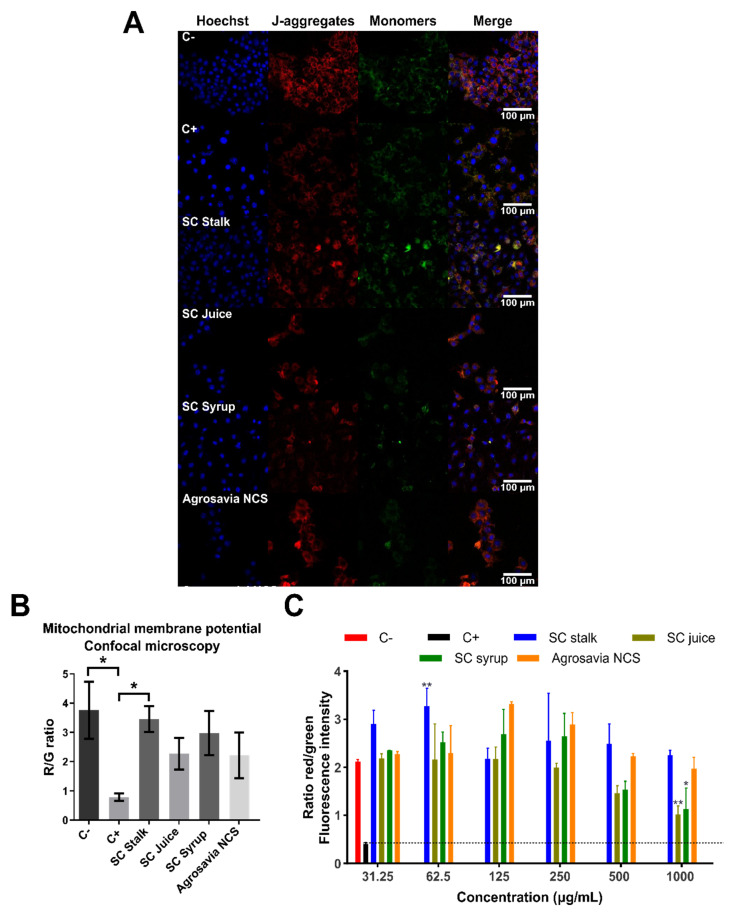
Changes in mitochondrial membrane potential. Negative control (C-): cells without rotenone treatment. Positive control (C+): rotenone. (A) Neuroblastoma (SH-SY5Y) cells were treated with rotenone (150 μM for 24 h). Posteriorly, the cells were washed with PBS 1X and incubated with the SC derivatives (1 mg/mL for 24 h). (B) R/G (Red fluorescence/Green fluorescence). Control (untreated cells) emitted red mitochondrial fluorescence with a small amount of green fluorescence (generated by a decrease in mitochondrial membrane potential) 3.759 ± 0.977 ratio. Cells treated with SC derivatives, where mitochondrial depolarization is generated, but the red fluorescence is still greater than the green one (3.455 ± 0.442 for SC stalk, 2.267 ± 0.537 for SC juice, 2.979 ± 0.758 for SC syrup, and 2.219 ± 0.784 for Agrosavia NCS). A significant decrease in the R/G ratio of the rotenone treatment (positive control) is observed compared to the negative control (healthy cells) and the SC stalk treatment. (C) Fluorescence intensity ratio of aggregates/monomers (red/green) in injured cells (SH-SY5Y neuroblastoma cells treated with rotenone) treated with SC derivatives as a function of concentration. Red and black columns represent healthy cells (negative control) and SH-SY5Y neuroblastoma cells treated with rotenone (positive control), respectively. Results were obtained by the ratio between the red/green fluorescence of the JC-1 dye. The plotted values represent the mean ± SEM of two independent experiments. Statistical analysis was performed by comparing the different treatments with respect to the negative control. (*) corresponds to statistically significant difference with a p-value in the range of 0.01 ≤ p-value ≤ 0.05, while (**) corresponds to statistically significant difference with a p-value in the range of 0.001 ≤ p-value < 0.01. The horizontal dotted line represents the membrane potential of the neuroblastoma cells treated with rotenone (* p-value ≤ 0.05).

